Playwright CI at Scale: What Works in GitHub and GitLab
Your Playwright pipeline is only as fast as its slowest shard. Learn what GitHub Actions and GitLab CI get right at scale, and the one thing neither solves.

Playwright's getting-started CI workflow breaks down once your suite grows into thousands of tests. At that scale, you hit long-tail workers, artifact sprawl, and rising CI costs. Whether you use GitLab's parallel keyword or GitHub's matrix strategy, both platforms share a fundamental limitation: they distribute work statically. Shards are assigned before execution begins, but test execution time is not static. A runner encountering network latency or a browser process hanging makes timing unpredictable.
Here's how GitHub Actions and GitLab CI handle Playwright at scale, where they break down, and when you need something beyond native CI tooling.
The Playwright CI/CD Scaling Problem
Shard Imbalance and Long-Tail Workers
Playwright has three layers of parallelism: workers within a machine (file-level), fullyParallel (test-level), and --shard (machine-level). They interact in ways that break at scale.
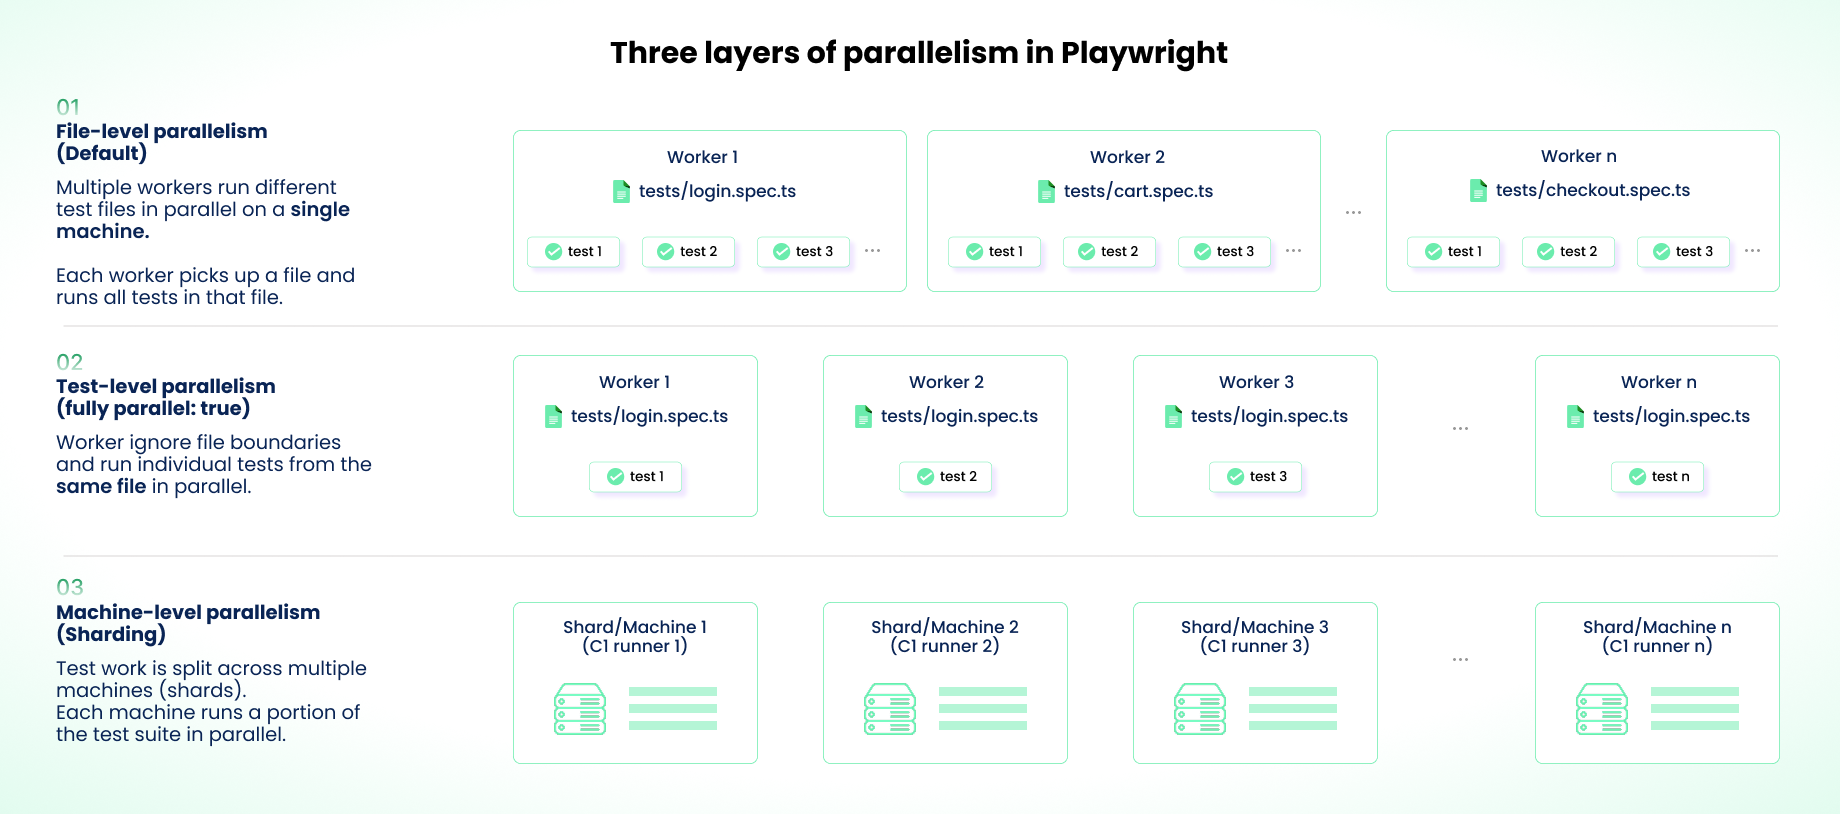
The most common mistake is cranking up both shards and workers simultaneously, which oversubscribes CPU and memory on CI runners and increases flakiness. Use sharding for cross-machine distribution and keep workers per shard low (2-4 in CI). Enable fullyParallel: true to get test-level distribution within each shard.
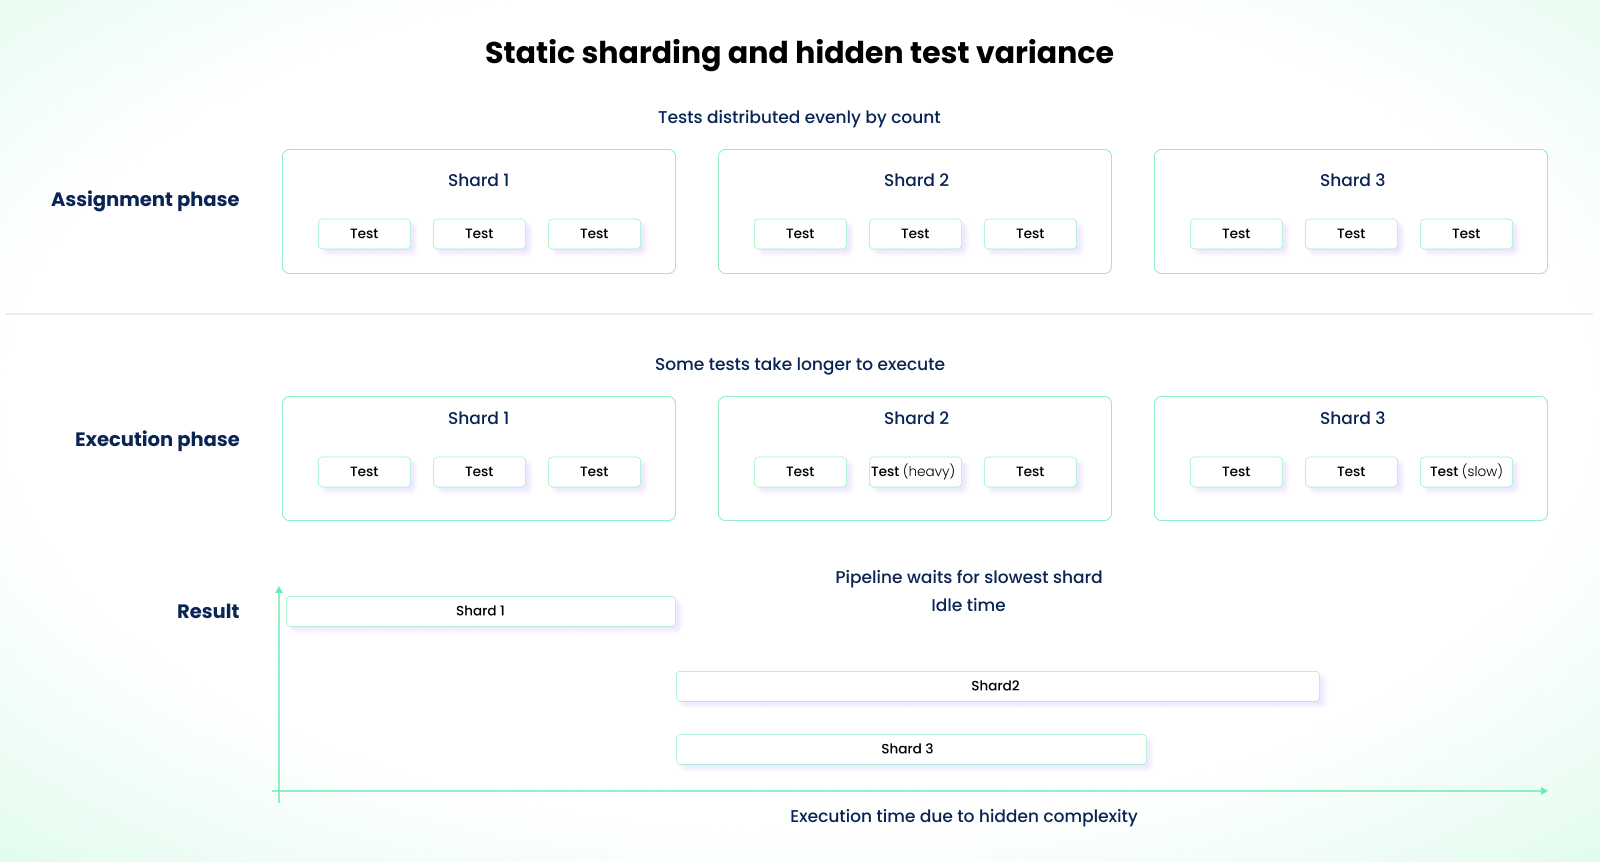
While this approach helps, it doesn't fix shard imbalance. Without fullyParallel, Playwright assigns entire test files to shards. A file with 50 tests lands on one shard while another gets a file with 10. With fullyParallel: true, individual tests are distributed by count, which is more even, but neither mode considers execution duration. A shard that gets five 30-second tests finishes far later than one with fifty 2-second tests, even if the count is balanced.
The nsxbet/playwright-orchestrator project published real data showing shard durations of 31min, 15min, 22min, and 11min in a 4-shard setup, where the slowest shard ran 182% longer than the fastest.
Playwright Report Sprawl
If you use the HTML reporter in sharded setups, you get separate outputs per shard. No aggregated view, no global pass/fail summary, no combined timeline. With 50 shards, that's 50 separate zip files to download and cross-reference. The HTML reporter's limitations run deeper than merging, but in a sharded setup, this is where they first become visible.
Use the blob reporter instead. It outputs machine-readable data that Playwright's merge-reports CLI command combines into a single HTML report.
While the blob reporter solves the merge view problem, there is a point before the merge where results are still in individual shards. If the merge job fails, you lose the global view. At 50-100 shards, merge failures happen. The merge job has to perform dozens of network requests to download blobs. If each shard produces a 10MB blob (with traces), the merge runner downloads 500MB to 1GB of compressed data and extracts even more to disk. Network latency and memory exhaustion become failure risks.
Retry Inflation
At scale, retries compound in ways that aren't obvious. Playwright's retries config re-runs a failed test in the same worker process with a fresh browser context. If the failure is environmental (CPU contention, /dev/shm exhaustion), the new context doesn't help because the underlying machine pressure is the same. Meanwhile, CI-level retries (GitLab's retry keyword or GitHub's manual re-run) restart the entire job on a fresh runner.
These two layers multiply. In the worst case, a test with retries: 2 inside a job with retry: max: 2 can execute up to 9 times (3 Playwright attempts per job, 3 total job runs). Each attempt generates its own trace and video artifacts, inflating storage. Across 100 shards, even a small flakiness rate produces significant CI waste. If 50 flaky tests retry once at 30 seconds each, that's 25 runner-minutes per PR. If you push 10 PRs a day and every flaky test fails on every run, that's over four hours of wasted compute daily.
Cap Playwright retries at 1 in CI. Use CI-level retries only for infrastructure failures, not test logic.
Cache Invalidation and Patterns
A common mistake: you update Playwright in package.json but don't update the cache key. CI restores stale browser binaries from ~/.cache/ms-playwright, and you get Executable not found or Browser version mismatch errors. These failures multiply across dozens of parallel shards.
Your cache key should include both the Playwright version and the lockfile hash:
key: playwright-${{ runner.os }}-${{ steps.get-version.outputs.version }}-${{ hashFiles('package-lock.json') }}
Another common waste: leaving npx playwright install unconditional in your YAML. Even with a warm cache, this runs a check-and-verify step on every job. Make it conditional:
if: steps.cache.outputs.cache-hit != 'true'
run: npx playwright install --with-deps
These problems compound. The choice of CI platform matters because each handles them differently.
GitHub Actions for Playwright at Scale
GitHub Actions gives you several tools for scaling Playwright, but each comes with limits you'll hit as your suite grows.
The Matrix Strategy and Its Limits
The core limitation of GitHub's matrix strategy is that the shard count is fixed at configuration time:
strategy:
  matrix:
    shard: [1, 2, 3, 4, 5, 6, 7, 8, 9, 10]
Tests don't all take the same time. You might expect each shard to take about four minutes, but some may take eight minutes while others finish much earlier. Some runners sit idle waiting for the longest shard to complete.
If a new PR deletes 500 tests, you end up with underutilized runners. If it adds 500 tests, you may become under-provisioned. You're applying static config to a test suite that changes constantly.
A partial solution is to use dynamic sharding to adapt the matrix to the test suite size. It involves running a lightweight setup job using npx playwright test --list --reporter=json to count tests, then piping that output into jq and exporting a computed matrix using echo "matrix=..." >> $GITHUB_OUTPUT for downstream jobs.
But dynamic sharding only adjusts the matrix size. It still produces a static shard assignment once jobs start.
A stronger approach uses Playwright's --test-list flag (v1.56+). You can build a setup job that reads historical test durations, performs bin-packing (e.g., Longest Processing Time First), and outputs a custom test list per shard. Each shard then runs npx playwright test --test-list shard-N.txt instead of --shard. The nsxbet/playwright-orchestrator project implements this pattern with a CKK algorithm and claims to bring shard variance within 10-15%. This is still a static assignment per run, but it's far more balanced than count-based splitting.
Caching Playwright Browsers on GitHub Actions
GitHub Actions uses a key-based cache with branch-aware lookup. Caches created on a feature branch aren't available to other branches unless they fall back to the default branch. This means the first run on a new branch always cold-starts. Those two to three minute downloads accumulate fast when you create short-lived branches. Combined with other overhead, these small delays are one of the reasons teams struggle to keep Playwright fast in CI.
Even for warm branches, GitHub enforces a 10GB per-repo cache storage limit across all plans. Paid plans can exceed it via pay-as-you-go at $0.07/GiB/month, but you probably haven't configured this. Each Playwright version's browser binaries (Chromium, Firefox, WebKit) range from 500 MB to 1 GB. If you have 10-15 active branches, each caching slightly different environments, the limit can be hit instantly.
GitHub responds to limit exhaustion by deleting the least recently used cache. But this can cause active feature branch caches to be deleted, leading to unexpected cold starts. In some cases, even the default branch cache may be evicted, slowing down critical workflows such as main branch deployments.
Mitigate this with a common fallback key that shares browser caches across branches. Monitor your cache usage in repository settings so you catch eviction issues before they become pipeline-blocking.
Artifact Handling and the Blob Reporter Pattern
By default, if one shard fails, your merge job can fail too since it won't find the expected file list. Use if: ${{ !cancelled() }} so the merge job runs regardless of shard failures but still skips on manual cancellation.
A common gotcha: upload-artifact@v4 requires each shard to upload artifacts with unique names. So you need to give each shard's blob a unique artifact name. For example, include a shard index:
- name: Upload blob report
  uses: actions/upload-artifact@v4
  with:
    name: blob-report-${{ matrix.shard }}
    path: blob-report/
Watch out: artifacts from upload-artifact@v3 and v4 are not cross-compatible. Mixing versions across workflows can produce artifact not found errors that look flaky but are actually version mismatches. For reports distributed across multiple artifacts, the merge job must use the matching download-artifact@v5 to download all shard outputs into a single directory before merging:
- name: Download all blob reports
  uses: actions/download-artifact@v5
  with:
    pattern: blob-report-*
    path: all-blob-reports
    merge-multiple: true
Reusable Workflows for Multi-Repo Organizations
If you run Playwright across multiple repositories, you need consistent sharding, caching, and artifact-handling patterns across all of them. GitHub's reusable workflows help, but they come with constraints.
First problem: there's a context boundary when setting environment variables using env. You have to separately configure env variables in each repo's YAML caller. For a complex end-to-end suite that needs 20+ config variables, YAML configuration for each repo becomes tedious. Store the variables as global variables and use vars instead of env so the reusable workflow can inherit them.
Secrets also can't be passed via with because the secrets context is not available in jobs.<job>.with expressions. The secrets: inherit configuration can be used instead, but it's a security risk. It makes all the secrets from the caller (including unneeded ones) available inside the called workflow. Safer: explicitly declare and pass only the secrets you need. But in large workflows, this becomes verbose and hard to maintain.
Additionally, reusable workflows have a 10-level nesting limit. At deeper nesting levels, debugging test failures gets harder. For example, if a test fails in a shard, the logs might show Error: BASE_URL is undefined. Because you are multiple levels deep in a reusable workflow, you can't easily see what the original caller (the first YAML file) passed as input.
GitHub Actions Billing at Scale
At scale, billing shapes how you structure your Playwright runs. Runners are billed per minute, which means a 20-shard matrix running for 10 minutes each results in 200 runner-minutes per workflow. Runner size affects your bill.
A larger 8 vCPU runner with more internal Playwright workers might be cheaper than spreading those tests across four smaller 2 vCPU shards, each of which incurs a setup overhead. However, larger runners come with higher per-minute costs, so the trade-off depends on how much setup and per-test overhead your suite has. Most of the time, the standard runner is sufficient. Note that the default specs differ by repository visibility: public repos get 4 vCPU / 16GB RAM, while private repos get 2 vCPU / 8GB RAM unless you configure larger runners (Team/Enterprise plans only).
Artifact storage adds up fast. The Team plan provides 2GB, and the Enterprise plan provides 50GB (shared with GitHub Packages; cache storage has its own separate 10GB limit). With 50 shards per PR and 10 PRs a day, you can generate large volumes of trace data within a week. Once you hit the storage limit, CI jobs can fail with a spending limit reached error. Reducing retention from the default 90 days to 3-7 days, based on your debugging workflow, prevents failures and avoids plan upgrades.
Concurrency groups are another way to reduce CI minutes by canceling redundant runs. If you push code, notice an issue, and push again shortly after, only the latest run continues. The previous one gets canceled.
But you have to configure group names to be workflow-scoped:
concurrency:
  group: "${{ github.workflow }}-${{ github.ref }}"
  cancel-in-progress: true
A bad configuration, such as group: ci, can cause workflows in the same GitHub repository to unintentionally cancel each other.
GitLab CI for Playwright at Scale
Parallel Jobs and the parallel Keyword
GitLab uses the parallel keyword with CI_NODE_INDEX and CI_NODE_TOTAL to distribute shards:
npx playwright test --shard=${CI_NODE_INDEX}/${CI_NODE_TOTAL}
It still hits similar limitations as GitHub. The shard assignment is static, so when a PR increases or decreases the test suite size, there is a risk of under-provisioning or over-provisioning. GitLab caps the parallel keyword at 200 per job definition, so larger test suites may still require splitting into multiple jobs or using dynamic child pipelines.
Dynamic child pipelines can fix this, but the setup is heavy: you run a parent job that counts tests, generate a new .yml on the fly, and trigger it as a child pipeline. Debugging failures in this setup is also harder, since it involves inspecting multiple generated configurations.
Even with this approach, the main limitation remains: shard assignment cannot adapt to actual test execution duration.
For cross-browser runs, you can combine parallel with a matrix. For example, five shards across three browsers:
parallel:
  matrix:
    - SHARD: [1,2,3,4,5]
      BROWSER: [chromium, firefox, webkit]
But GitLab expands logs from these runs into a flat list. If the parallel count reaches 60+ jobs, finding a failed shard in the pipeline view becomes harder than in GitHub's grouped job view.
GitLab Caching: Distributed vs. Local Behavior
GitLab's cache for hosted runners is typically backed by distributed object storage such as S3 or GCS. It allows you to define a global key, ensuring cache hits are consistent across runners and reducing cold-starts on feature branches.
But distributed caching is a network-bound operation. On every job, the runner has to download from S3, unzip, run tests, then zip and upload back to S3. For Playwright, caches can easily exceed 1GB. At 50 shards, this can mean moving tens of gigabytes of data across the network for a single pipeline run. This strains the runner's CPU and adds minutes of overhead from repeated compression and decompression. If your internal network or object storage throughput is limited, a cached run can actually take longer than a clean install.
A bad upload from a misconfigured branch can also break other jobs using the same cache. If a shard is the last to complete but experiences a network issue, it could overwrite the cache with a partial state. Mitigate this with cache:when: on_success, so failed jobs do not pollute the cache.
Use cache policy settings to ensure that only the default branch or a designated warm-up job has push privileges. Feature branches should use policy: pull only.
rules:
  - if: $CI_JOB_NAME == "cache-warmup"
    variables:
      CACHE_POLICY: pull-push
  - if: $CI_COMMIT_BRANCH == $CI_DEFAULT_BRANCH
    variables:
      CACHE_POLICY: pull-push
  - when: always
    variables:
      CACHE_POLICY: pull

cache:
  policy: $CACHE_POLICY
For self-hosted GitLab runners, the cache is local to each runner. While this avoids the network overhead of distributed caching, it means each runner maintains its own cache. If your job runs on Runner A today, Runner B will not have access to that cache. This can lead to inconsistent performance, where one pipeline completes quickly and another takes much longer, depending on which runner picks up the job.
Artifacts, Job Dependencies, and DAG Execution
While the blob reporter helps merge results, it requires that the merge stage wait for all jobs in the test stage to complete. Using needs enables DAG execution, allowing the merge job to run without waiting for unrelated jobs to finish. In a scenario where you have 50 Playwright shards and one lint Job, merge would run after the shards complete without waiting for the lint job. It saves you unnecessary waiting time that compounds with every PR.
But by default, needs downloads all artifacts from every job it depends on. If your install-deps job produces a 1GB node_modules artifact and your 50 shards produce 10MB each, the merge job will attempt to download all of them. Use artifact control to skip re-downloading large dependencies, such as node_modules. For example:
merge-reports:
  needs:
    - job: shard-job
      artifacts: true # Download only the blob reports
    - job: install-deps
      artifacts: false # Wait, but skip large node_modules
But even then, these features do not prevent the final report from failing if a shard fails to upload its blob.
GitLab Runners: Shared vs. Self-Hosted Tradeoffs
Shared runners let you scale to 50+ shards without managing infrastructure. But they have variable CPU/memory. If other workloads on the same infrastructure are heavy, you get CPU contention. For Chromium, whose browser timing and event scheduling are sensitive to CPU availability, your Playwright tests start failing with timing issues. A button click that takes 10ms locally might take 200ms on the runner, causing locator.click() to time out waiting for actionability or hit an overlay that loads slowly.
/dev/shm is another pain point. Chromium uses shared memory to pass data between its processes, and many shared runners default to 64MB. Running multiple parallel tests on one runner exhausts this limit, causing out-of-memory errors that look like flaky failures.
On self-hosted runners, fix this directly:
[runners.docker]
  shm_size = 1000000000  # ~1GB instead of 64MB
Alternatively, pass --disable-dev-shm-usage to Chromium to use disk instead, though this slows execution. As a baseline, aim for at least 2 vCPU and 4GB RAM per shard for Chromium. WebKit and Firefox are less resource-hungry.
Common Patterns Across Both Platforms
Retry Strategy at the CI Level vs. Playwright Level
Here's how each platform handles CI-level retries:
In GitLab CI, the retry keyword restarts the job on a fresh runner and supports the when filter to target specific failure types:
retry: { max: 2, when: [runner_system_failure, stuck_or_timeout_failure] }
GitHub Actions does not provide a native retry keyword. Retries are handled using third-party actions, such as nick-fields/retry@v4, or by manually re-running workflows, which makes retry behavior less granular.
Selective Test Execution
Running 500+ tests for a one-line change is wasteful. Both platforms support selective execution: GitLab has built-in rules:changes, GitHub has dorny/paths-filter.
The hard part isn't setup, it's maintaining the mapping. Path-based filters don't understand dependency graphs. A shared file like src/api/client.ts used across multiple modules won't trigger tests in unrelated directories, even though those tests depend on it.
Tag-based filtering is more reliable. Tag tests by module (@auth, @payments, @checkout) and run only matching tags when relevant code changes. Wire this up by mapping changed paths to tags in a small script or config file, then pass the result to Playwright via --grep or npx playwright test --grep @auth. But selective execution doesn't replace full suite runs on main. Use it for PR pipelines only.
Platform Comparison at a Glance
| Dimension | GitHub Actions | GitLab CI |
|---|---|---|
| Sharding syntax | Matrix strategy with explicit shard list | parallel keyword with CI_NODE_INDEX / CI_NODE_TOTAL |
| Dynamic shard count | Possible via setup job + jq matrix generation, but requires custom scripting | Not natively supported; parallel value is static |
| Cache model | Key-based caching; 10GB per-repo limit (all plans, pay-as-you-go above); LRU eviction | Distributed object storage (S3-backed on shared runners), more consistent across runners |
| Artifact merge | Requires explicit merge job; upload-artifact@v4 requires unique names per matrix job | dependencies / needs keywords control artifact flow between jobs |
| Native job retry | None built-in; requires nick-fields/retry@v4 or re-run logic | retry keyword with when filter (e.g., runner_system_failure) |
| Runner reliability for browsers | Hosted runners have adequate /dev/shm; 4 vCPU/16GB (public) or 2 vCPU/8GB (private) | Shared runners vary; Docker runners need --shm-size=1gb or --ipc=host for Chromium |
| Redundant run cancellation | concurrency groups with cancel-in-progress: true | Project-level auto-cancel + interruptible: true + workflow:auto_cancel:on_new_commit |
| Billing model | Per-minute runner time + shared artifact/cache storage quota | Per-minute compute; self-hosted runners avoid compute charges |
These patterns help, but they don't address the underlying model.
When Native CI Hits Its Ceiling
In native CI systems like GitHub Actions and GitLab, when you divide tests into shards, you assume each shard will take roughly the same time to run. But a shard can hit a heavy checkout flow, causing it to take longer to complete. Because the CI cannot move tests from the heavy shard to the idle one, the entire process waits on that shard.
With that shard running longer, the browser process stays exposed to the runner limits for longer. On shared runners, this increases the chance of hitting CPU dips or /dev/shm memory limits. The test may then fail due to environmental pressure, and retries run under similar conditions can cause the same failure to repeat.
As those retries accumulate, Playwright generates traces and videos for each attempt. Instead of one report, you may end up with multiple traces for a single failing test across shards.
At the same time, repeated executions put pressure on caching. In some setups, a failed or partial state can be pushed into the cache and affect subsequent runs.
All of this traces back to one limitation: shards are distributed statically at configuration time, while test execution time varies at runtime. Playwright v1.56 introduced --test-list, which lets you feed a custom list of tests to each shard, and v1.58 added an experimental PWTEST_SHARD_WEIGHTS env var for manual weight assignment. These are building blocks, not solutions. You still have to build the duration-tracking, bin-packing, and list-generation logic yourself, and tests are still assigned upfront with no way to adjust distribution during execution.
Configuration tweaks do help, but they don't change the model. To fix this, you need external orchestration.
External Orchestration as the Architectural Answer
An external orchestration layer uses a combination of historical test duration and dynamic test distribution to assign tests to workers in real time.
When a CI run starts, the orchestrator listens for workers that signal availability and assigns them tests. As a worker completes execution, it signals availability again until all tests are executed. When historical data is available, the orchestrator prioritizes longer tests first. The process continues, with faster workers constantly being fed tests, so they tend to finish around the same time.
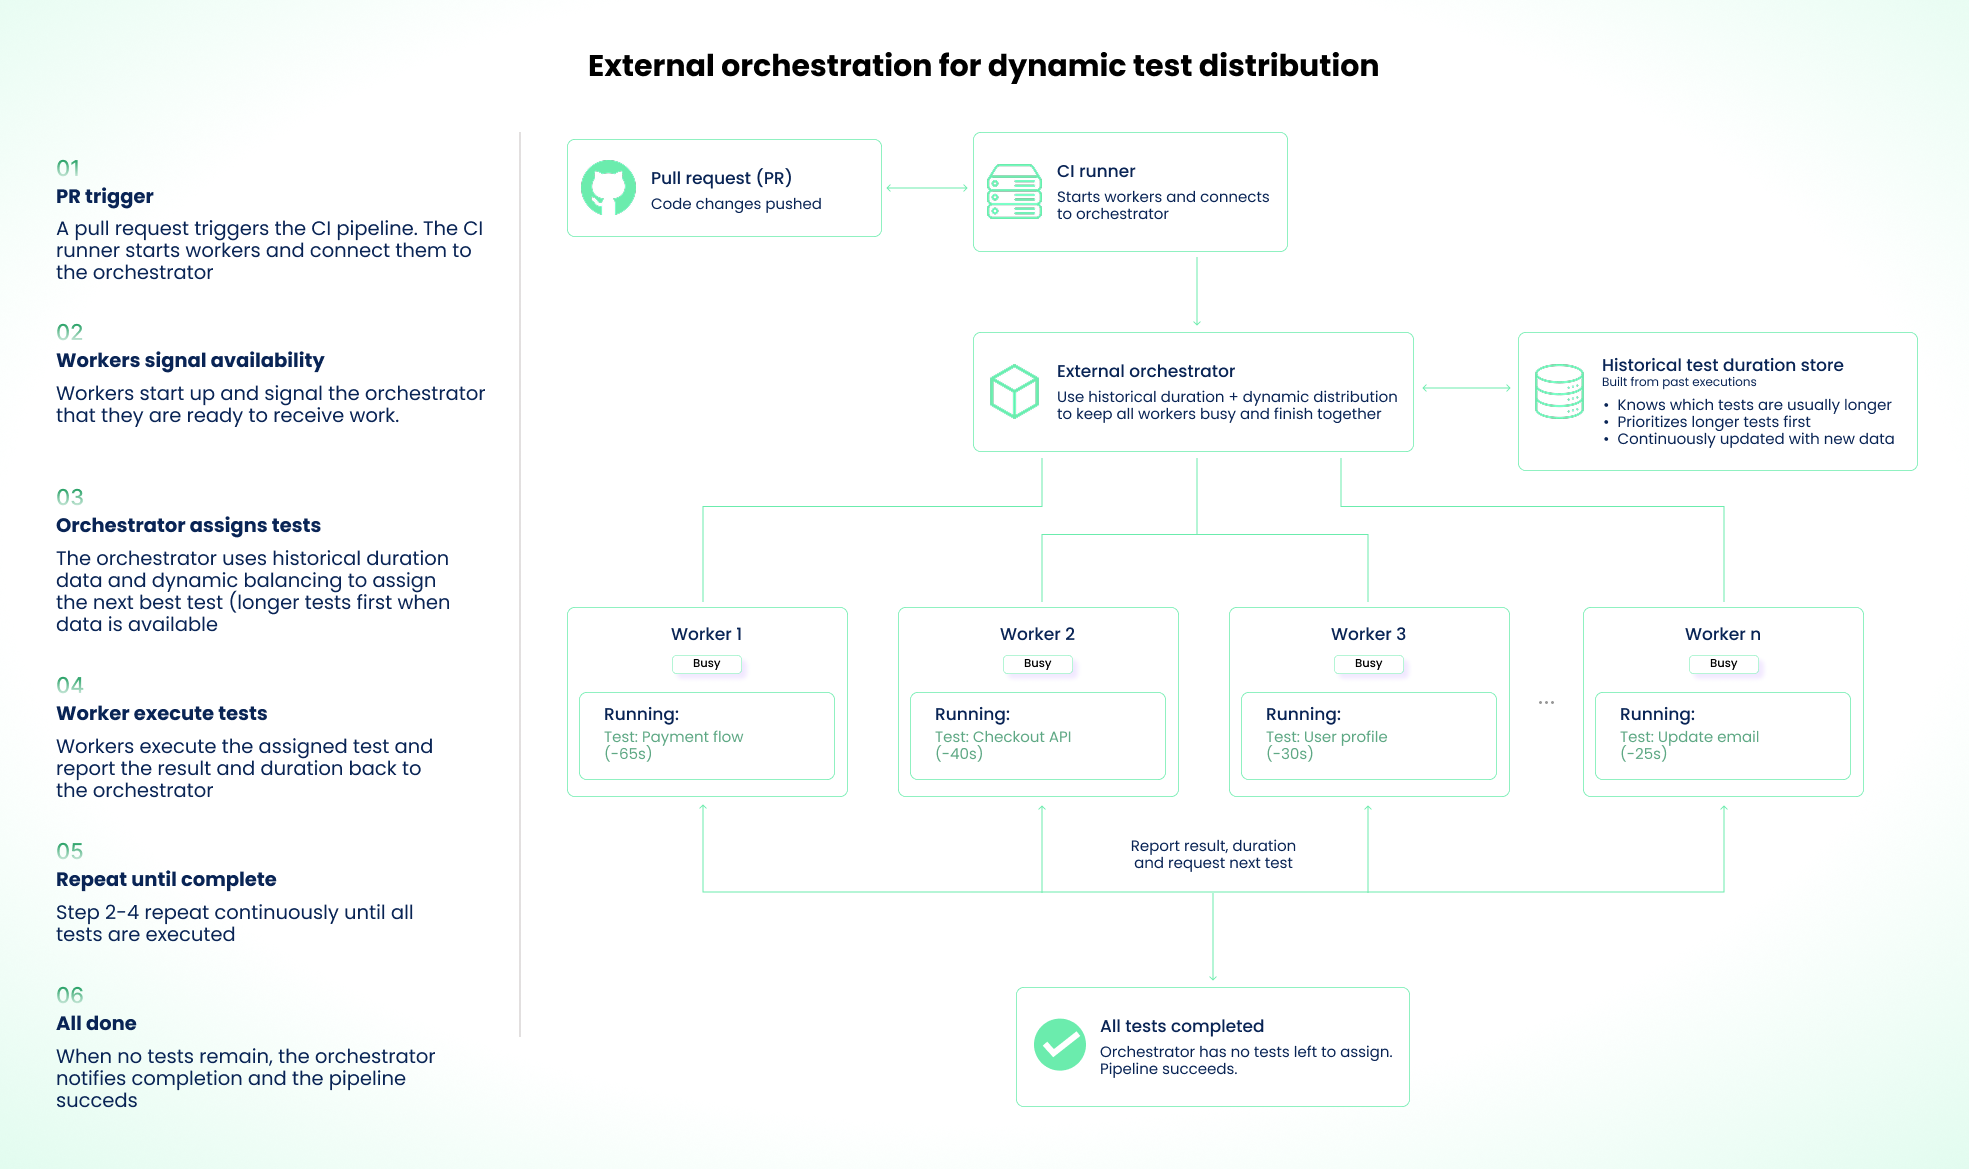
The trade-offs are real. You add a dependency on an external service: if the orchestrator is down, your CI either falls back to static sharding or fails entirely. On the first run (or when new tests are added), there's no historical data, so the orchestrator assigns based on heuristics or defaults to even distribution. Each test assignment requires a network round-trip between worker and orchestrator. That adds small per-test overhead that varies by network topology. It's negligible for long tests but adds up for suites with thousands of sub-second tests.
What you get in return: worker utilization improves, long-tail execution drops, and you stop manually tuning shard counts. The same orchestration logic works across GitHub Actions and GitLab CI, replacing platform-specific matrix strategies, blob reporters, and merge jobs with a single integration point.
Currents is one implementation of this model that handles orchestration, artifact streaming, and flakiness tracking as a managed service.
But don't reach for orchestration reflexively. It's worth it only after you've exhausted native solutions.
The Decision Threshold
Use shard duration variance as your primary diagnostic. Measure the time difference between your fastest and slowest shards over 20+ runs.
The formula:
((Slowest Shard Time − Fastest Shard Time) / Slowest Shard Time) × 100.
Rough interpretation:
- Below 20%: Native sharding is working. Optimize caching and Docker images, but don't add orchestration complexity.
- 20-50%: You're paying for idle runners. Try
fullyParallel: trueand--test-listbin-packing before reaching for orchestration. - Above 50%: Static distribution is failing. This is where orchestration reduces both total test time and CI cost.
These thresholds are starting points, not rules. Your tipping point depends on CI cost per minute, team size, and how much engineering time goes into maintaining configs. If you're paying $0.008/min on GitHub Actions, your math is different from self-hosted runners.
Other signals that matter: Are you spending more than an hour per month adjusting YAML and shard counts? Do you maintain separate sharding configs for GitHub and GitLab? Do your artifact merge jobs fail regularly? If yes to any of these, you're already paying the operational cost that orchestration would eliminate.
Wrapping Up
CI performance at scale comes down to two things: how evenly work is distributed and how quickly you can debug failures in CI. Static sharding provides a baseline, not a solution.
Start with fullyParallel: true, conditional caching, and the blob reporter. Measure your shard duration variance. If it's consistently above 50% and you've already tried --test-list bin-packing, configuration alone won't fix it. That's when external orchestration earns its keep.
Further Reading
Playwright parallelization patterns for CI
Join hundreds of teams using Currents.
Trademarks and logos mentioned in this text belong to their respective owners.