Playwright HTML Reporter: Why It Breaks Down at Scale
When Playwright suites grow, pass/fail reports stop being enough. Learn what teams need instead for flakiness detection, worker visibility, and trend analysis.

Your Playwright suite starts at a few dozen tests. Six months later, it's three hundred. Somewhere in there, the HTML reporter stopped being useful. Tests fail, you retry, something passes, you move on. No one on the team can tell you whether the suite is getting more reliable or less.
At that scale, a pass/fail report isn't enough. You need to know whether the suite is getting healthier or degrading, how tests behave across multiple runs, which failures are correlated, and where to invest engineering effort. The focus shifts from collecting results to reading them.
This article walks through where Playwright's native reporting falls short once the suite grows, why the gap isn't a rendering problem, and when to move to something that answers the operational questions the HTML reporter can't.
Playwright's HTML Reporter Was Built For A Different Problem
The native reporter is a debugging UI. It was designed for developer-friendly inspection of test results during local runs with npx playwright test or in smaller CI executions.
It works well for:
- Single-run debugging. When a handful of tests fail, you get the stack trace, the video, and the trace viewer per failure. That's the whole loop for fixing a broken test.
- Small suites. In our experience, you can eyeball 20 to 50 results per run without losing track of which is which.
- Sequential execution. With a single worker, results appear in test order. You don't need to reason about CPU contention or shared database state to interpret the output.
Used this way, the reporter is effective. You get green and red indicators per test, error context inline, and a single self-contained HTML artifact.
Once you introduce multiple workers running in parallel, the limitations show up. Results from separate worker processes are aggregated into one report, but the HTML reporter does not preserve the execution context behind them.
For cross-shard runs, Playwright provides the blob reporter and the merge-reports command to combine sharded runs into a single report. That still doesn't show how failures cluster across workers or how tests were distributed during execution. The reporter isn't built for structured analysis across parallel runs, flakiness detection at scale, or multi-run trend analysis.
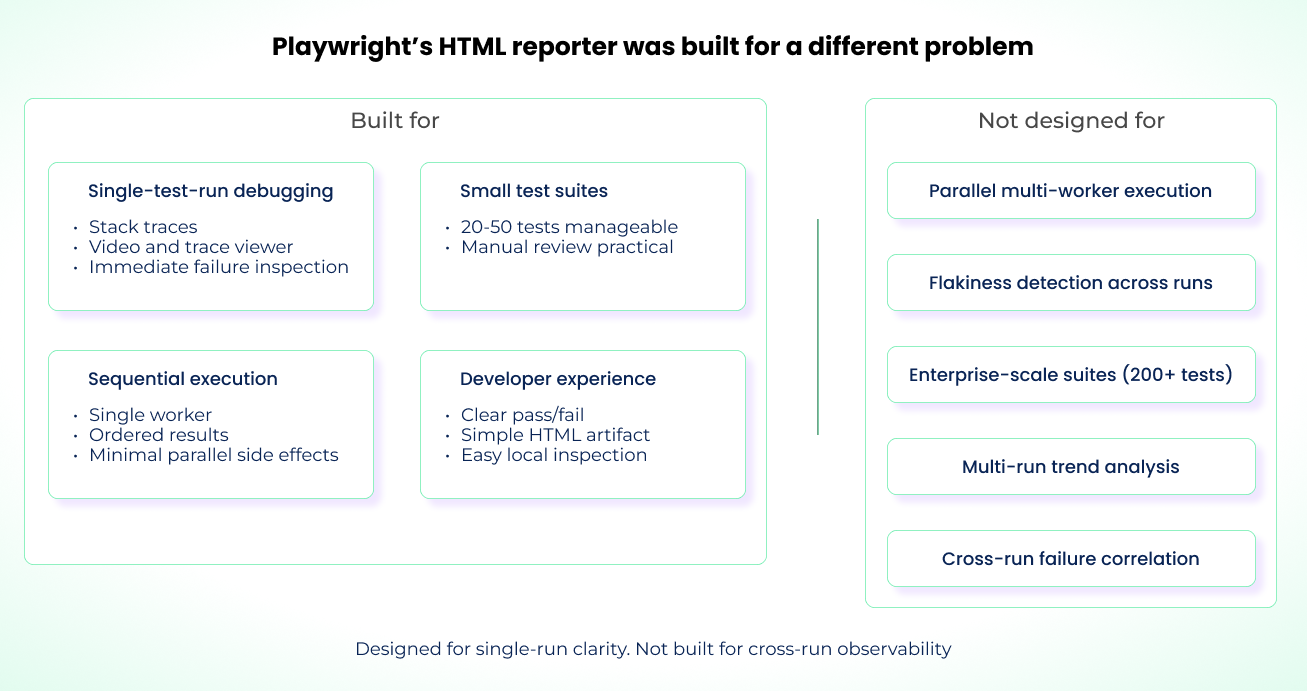
The report can show: "Two tests out of ten failed, and here is what went wrong."
It cannot show: "Your CI failure rate is 15 percent across the last 10 runs. Reliability is degrading, and the failures correlate with the payment integration tests."
To understand why, it helps to look at how the reporter is wired internally.
How the HTML Reporter Actually Works Under the Hood
Playwright's built-in reporter is event-driven and operates entirely in memory. It treats every test run as a clean slate and does not retain information about previous executions.
The reporter listens for lifecycle events such as:
onBegin(config, suite), which receives the resolvedFullConfigand the rootSuitecontaining all projects, files, and test cases.onTestBegin(test, result), which fires when each test starts and hands you aTestCaseplus aTestResultthat's populated as the test runs.onTestEnd(test, result), which fires when the test finishes and hands you the finalTestResult. Note thatTestInfois only available inside test bodies, not to the reporter.onEnd(result), which runs after all tests finish and receives aFullResultwith the overall status.
The reporter acts as an observer in the test runner pipeline, receiving structured events emitted by the runner as the suite executes.
During execution, the HTML reporter's only concern is the current run and the result tree it builds in memory from Suite, TestCase, and TestResult objects. The TestResult includes useful execution metadata: workerIndex (which worker ran the test), parallelIndex (worker slot from 0 to workers-1), retry count, duration, attachments, and annotations. The data is there. The HTML reporter just doesn't surface it in a way that makes cross-test or cross-run analysis practical. Because it aggregates in memory, the report artifact only exists once the run finishes.
The reporter also has no awareness of prior runs. There's no persistent database, no cross-run schema, and no native way to link retries or PR runs to main branch runs via a unified run ID. Once execution completes, it serializes the suite and test result data into JSON and embeds that payload in the generated HTML bundle.
The blob reporter softens the distributed-CI pain, but not the historical one. It produces a .zip artifact at the end of a run so you can combine multiple sharded runs into a single HTML report via merge-reports. That solves cross-shard aggregation for one execution. It does not link results over time, normalize data across executions, or stream anything to disk mid-run. If a CI container dies partway through, the blob artifact dies with it.
That's why the reporter struggles at scale or in distributed CI: each run produces a standalone artifact, and you end up with too many to analyze manually.
The Information Overload Problem at 200+ Tests
At 200+ tests, failures stop being single events and start being patterns. That's where the native reporter's structural limits show up.
The Failure Flood
At about 50 tests, a 10% failure rate means five red results you can track, keep in your head, and inspect individually. At 300 tests, the same 10% is 30 failures per run. The HTML reporter presents them as a flat chronological list, ordered by test completion rather than by failure type or recurrence.
Prioritizing which to fix first becomes manual work. Questions like "is this new or recurring?" only get answered by opening each failure. The common trap is fixing the easiest failures instead of the most important ones.
The Pattern Blind Spot
Playwright's HTML reporter does flag tests that pass on retry within the same run as flaky. That's useful but narrow. It tells you nothing about whether this test was flaky yesterday, whether three other tests are failing with the same stack trace, or whether a failure you're looking at is a fresh regression or a known offender. Those patterns aren't surfaced in a way that makes them easy to identify.
For example, consider a CI run where five different tests fail with the same "Timeout 5000ms exceeded while waiting for selector" error. On retry, two of the tests pass while the others continue to fail. At first glance, this looks like a mix of flaky and unrelated failures. In reality, all five tests depend on the same dynamically rendered DOM element that loads slower when CPU usage is high.
Parallel Execution Without Visibility
Multiple workers will get a 300+ test suite down to nine minutes, but the native reporter makes the execution context opaque. The raw data is there, but you can't see whether Worker 1 finished its assigned tests in two minutes while Worker 8 took nine. Load across workers may be imbalanced, and you're paying for CI compute you aren't using. Without worker-level visibility, you also can't see when failures cluster on a specific shard, which usually points to an environment problem rather than a code defect.
The download-and-rerun loop is a real pattern at scale. Ramp Network sat in it before switching reporting tooling: flakiness drifting up, every morning spent hunting through artifacts for yesterday's failures, retries masking the symptoms. Once they had cross-run visibility, they drove flakiness near 0%, cut average test duration by 32%, and ran 62% fewer CI machines. The details are in the Ramp Network case study.
The code didn't change. What changed was knowing which failures were new, which were patterns, and which workers they clustered on. That's a reliable Playwright suite problem, not a reporter rendering problem, and it's the one native HTML can't help with.
The Gap: Result-Focused vs. Observability-Focused
The native reporter is straightforward for single-run results: test duration, error messages, pass/fail status, skipped tests, and (optionally) traces, screenshots, and logs. For one execution, it contains everything you need.
Across hundreds of executions, a self-contained result isn't enough. What matters is how results correlate across runs: whether a test fails intermittently or consistently, whether certain workers handle more load, and what those signals say about reliability and performance over time. That's a test observability problem.
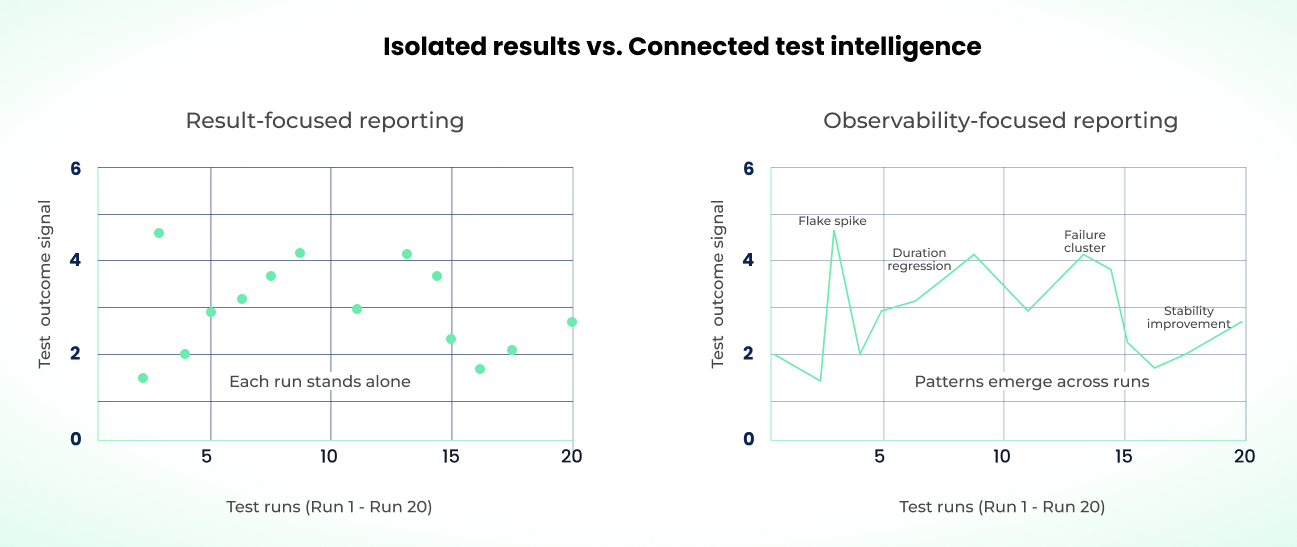
The native reporter can't fill this gap on its own. Telling a new regression apart from a recurring failure requires historical data, trend analysis, failure pattern recognition, and execution context across environments.
If you keep relying on run-level reporting past ~100 tests, you can still debug individual failures. But you'll keep losing the cross-run questions. And when your workflow revolves around pull requests in CI, that gap gets louder and the on-call rotation starts feeling it.
The Branch and PR Visibility Gap
Most teams run tests in CI pipelines triggered by PRs. If tests pass, you merge. But when the report only considers the current branch, you can't tell whether the same test is also failing on another feature branch or on main. Every PR becomes a narrow "make it pass" objective with no reliability context around it.
The cross-run questions remain the hard ones: is this test unstable only on the feature branch, or is it also failing on main? Did this PR introduce a new flaky test, or is it a known intermittent failure? At which commit did reliability start to degrade?
A green-on-retry signal is not the same as a stable-green signal. If your PR gate accepts "passed after two retries" as a pass, you're letting race conditions, database contention, and worker isolation bugs through the gate. The branch merges, the instability lands on main, and now every other PR that rebases inherits it.
In a PR-driven deployment model, reporting needs to be branch-aware: how the current branch compares to main, how it compares to other open PRs, and how each commit affects test stability. Without that, you're aggregating unknown reliability into main. This is the gap that usually pushes teams to build their own reporter.
Why You End Up Considering a Custom Reporter
Once the native HTML reporter stops working for you, the first instinct is usually to build your own. You know your system, you know where the blind spots are, and Playwright exposes the API.
That API does let you extend results into more advanced systems. You can hook into onTestEnd to stream test results to a database, push metadata into an analytics pipeline, or fan out to multiple reporters at once. Plenty of teams have built internal dashboards this way. The setup is the easy part.
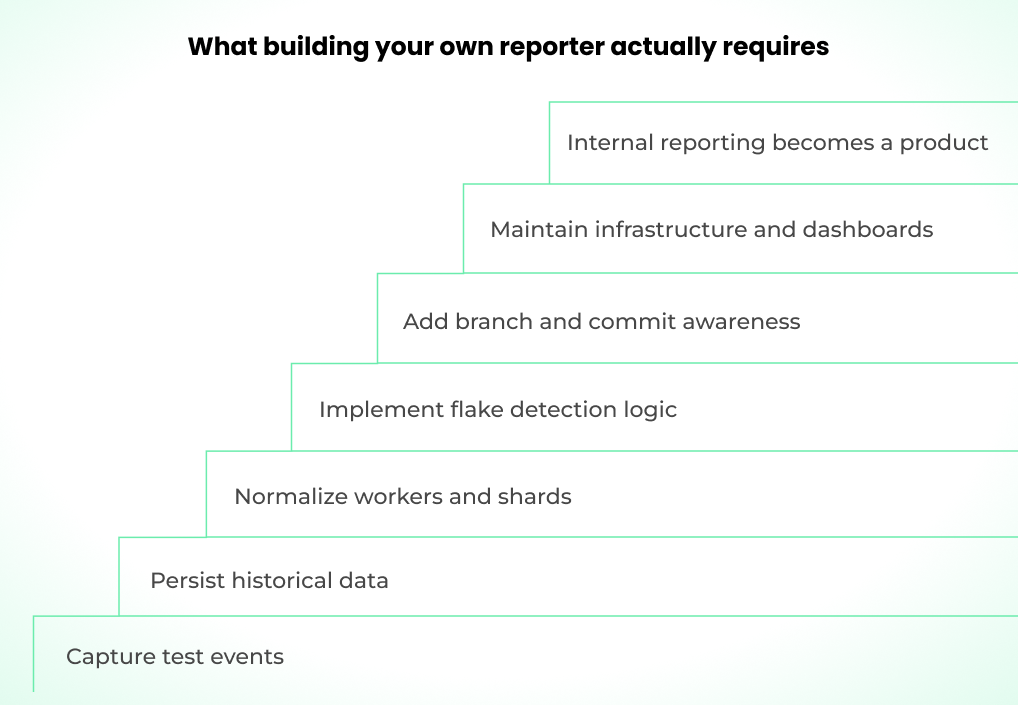
For a suite at scale, you're on the hook for a database that holds historical test data, kept secure, with enough schema stability that results from different CI runs, machines, and environments stay comparable over time.
You also have to aggregate worker IDs and shard indices across parallel executions to reconstruct a coherent view of each run. Flakiness detection means writing the algorithms that trace test behavior across retries, branches, and extended time windows yourself.
Correlation analysis has to be implemented carefully to surface shared failure patterns across tests without generating noise. Your reporter needs to be Git-aware so it can tell feature-branch instability apart from regressions on main.
Time that should go into your core product or test coverage drifts into maintaining an event-driven reporting system instead.
It's not impossible to build. It's a whole new product inside your company: data modeling, engineering, ownership, security, infrastructure maintenance, and ongoing iteration. That's real headcount and real spend.
At that point, integrating with an established reporting service is usually the better trade. The cost of getting visibility wrong on parallel test execution in production only goes up with the size of the suite.
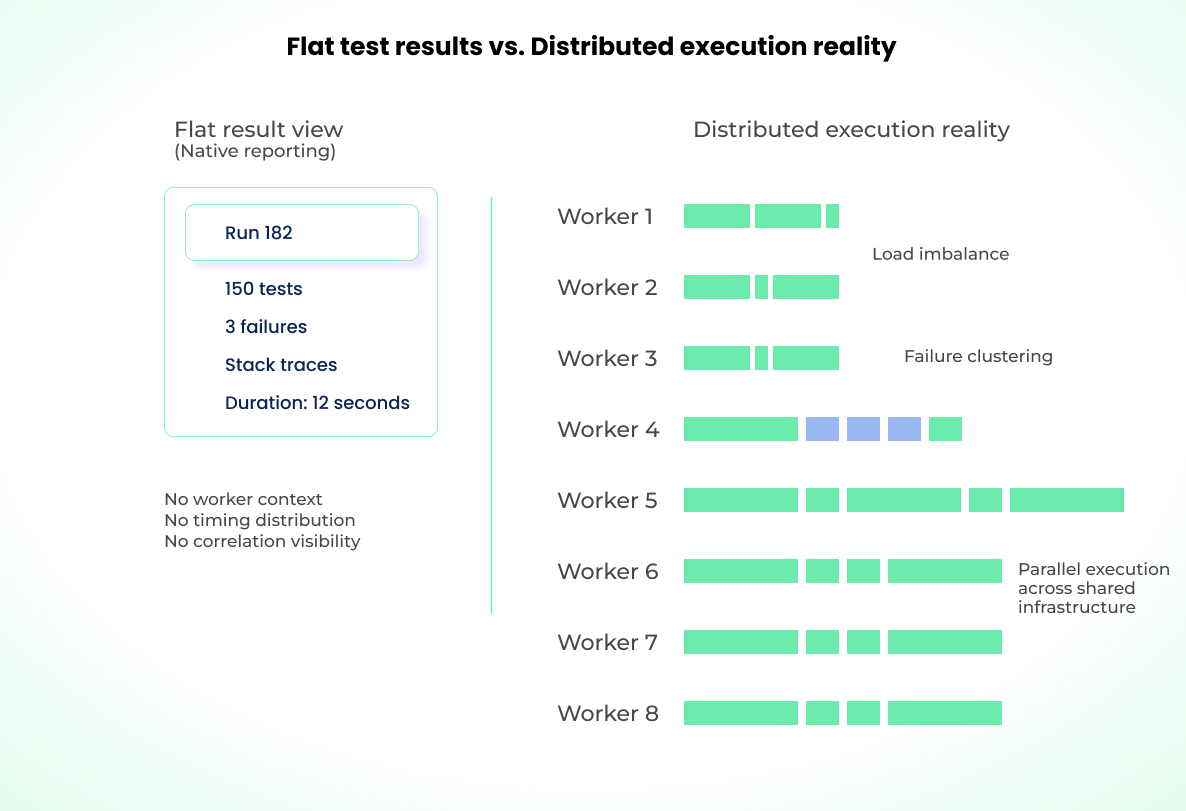
The Hidden Cost of Parallel Execution Without Visibility
Parallelization is what gets a large suite into a 10-minute CI window. Multiple workers, often across multiple machines, share infrastructure and external dependencies like databases, mock services, and network bandwidth. That interdependency is what makes parallel execution fast, and it's exactly what the native reporter can't visualize.
The reporter might show:
- Tests 1–37 passed
- Tests 38–75 passed
- Tests 76–112 passed
- Tests 113–150 failed with three failures
But it cannot show how those 150 tests were distributed across 8 workers simultaneously, which workers are consistently slower, or which worker handled the failing tests.
Parallel execution introduces four visibility problems:
Load Imbalance Invisibility
Native Playwright sharding distributes tests by count, not by execution weight. With eight workers, workers 1, 3, 6, and 8 might all finish within five seconds running fast tests. Worker 5 might inherit most of the slow tests and finish in 12.
The native reporter shows you the overall run duration was 12 seconds. It doesn't surface how long each worker spent on its assigned tests. If you want shorter execution time, you add more workers and see the same result. Per-worker visibility would tell you the real fix is rebalancing the shard, not buying more CI.
Cross-Worker Failure Patterns
When tests 80, 91, and 95 fail, the native reporter lists them as separate failures. You debug them as unrelated issues. With worker visibility, you'd see all three ran on Worker 4, which shifts the diagnosis from "three flaky tests" to "that worker or its environment has a problem." Without that view, the only way to find the correlation is digging through logs by hand.
Flakiness Misattribution
In a parallel environment, flakiness is often a symptom of isolation failures (one worker's state affects another), resource contention, or timing issues. The reporter surfaces the failure without that context, so you'll typically assume the test itself is flaky. With worker-level visibility, you'd see the test only fails in parallel and attribute it to environment or isolation instead.
False Confidence in Speedup
Your total test time drops from 40 seconds serial to 12 seconds parallel, and someone on the team tells leadership you got a 3.3x speedup. If the load is poorly balanced, you're actually bottlenecked on the slowest worker. Several workers finished seven seconds earlier while one is still grinding through the heavy tests. The speedup is real but the headroom is fake.
Left alone, these issues degrade test performance, waste compute, and stretch debug cycles. The time to audit for them is before the symptoms are obvious.
When To Outgrow Native Reporting
Moving off the native reporter isn't an overnight decision, but there are clear signals that say you're past the point where it's helping you. Start with suite size, then cross-check against pain indicators.
When Native Reporting Is Enough
Not every team needs external reporting. The HTML reporter handles many real-world situations fine:
- Small, stable suites. Under 50 tests that rarely fail? You don't need trend analysis when you can remember yesterday's failures. The overhead of a reporting platform isn't worth it.
- Single-machine CI. If your entire suite runs on one worker in under five minutes, you don't have the parallelization complexity that makes worker-level visibility valuable.
- Low release frequency. If you deploy weekly or less, you have time to investigate failures manually. The ROI on cross-run analytics depends on how often you're looking at test results.
- Greenfield projects. Early-stage products change constantly. Test suites churn. Investing in reporting infrastructure before the test architecture stabilizes usually means migrating that infrastructure later.
- Teams that already have observability elsewhere. If your CI system (GitHub Actions summaries, GitLab test reports) or APM tooling already gives you failure trends and you're satisfied, the HTML reporter's job is just local debugging.
The native reporter does one thing well: show you what failed in a single run and give you the artifacts to debug it. If that's the question you're answering most of the time, keep using it.
Test Suite Size
No universal threshold dictates when to swap reporters. The ranges below are where friction typically shows up:
- Under 50 tests (green zone): Native reporting is fine. Runs are fast, failures are rare, and you can hold each test's history in your head.
- 50 to 150 tests (yellow zone): Cracks appear. You're running parallel workers to keep CI fast. You notice the same test failing sometimes and passing others. Cross-run visibility is useful but not yet urgent.
- 150 to 300 tests (orange zone): Failure volume increases. Parallel execution stops being optional. Cross-run comparison by hand gets tedious. Cross-run visibility moves from nice-to-have to required for reliable deployments.
- 300+ tests (red zone): The native reporter is the bottleneck. Patterns are in the data but not in the view. You can't contextualize failures fast enough to keep up with the release cycle. You need a dashboard that tracks runs over time.
Pain Indicators
If suite size alone isn't decisive, these signals are:
- Investigation time: If diagnosing a single CI failure routinely eats 15 to 20 minutes before you even start forming a hypothesis, you have a visibility problem. Teams we work with consistently report this dropping to a few minutes once they can see failure history and correlated tests in one place.
- Flakiness triage load: If triaging and rerunning flaky tests is eating a meaningful chunk of sprint capacity, you're paying for blind spots. Engineering effort is going into repeated investigations instead of structural fixes.
- Inability to answer trend questions: If defining "are our tests getting better" needs manual spreadsheets of CI data, you don't have the visibility you need.
- Parallel efficiency uncertainty: If you can't tell whether your workers are balanced or whether failures cluster by shard, you're running parallel execution blind.
- Reliance on retries to stabilize CI: If raising your retry count is your go-to strategy for keeping CI green, your reporting is masking symptoms, not exposing causes.
Past 50 tests, if two or more of these are routinely true, it's time to evaluate external reporting.
The payoff shows up in case-study metrics. FundGuard cut CI duration by 50% and CI spend by 70% after moving to Currents for orchestration and reporting (see the FundGuard case study). n8n reduced flaky tests by ~90% during their Cypress-to-Playwright migration (case study). The common thread is redirecting engineering time away from "is this flaky or broken" triage and into fixes that actually stick.
What a Test-Observability Layer Gives You
A test-observability layer goes beyond "what failed." It tells you what those failures mean for your workflow and your suite's health. The features below are what you get when you stop looking at individual runs and start looking at them together.
Flakiness Detection and Quarantine
The tooling tracks failure frequency for every test across hundreds of runs. You can see at a glance whether a failure is a one-time anomaly or a persistent intermittent issue. A test that fails two out of ten runs gets flagged as flaky instead of treated as a new regression. You can then quarantine it, keep collecting data, and stop it from breaking the CI gate.
Cross-Run Trend Analysis
With analytics, you track failure rate trends over weeks, see which tests are degrading in reliability, and check whether your stabilization work is moving the numbers. Trend conversations turn into data instead of opinions.
Failure Correlation
When multiple tests fail at once, they're rarely unrelated. A correlation view can surface shared dependencies, like an auth service outage or an environment blip. If several login-related tests fail at the same time, authentication gets flagged as the shared dependency. You stop fixing individual tests and start diagnosing the system.
Worker and Parallel Utilization Visibility
With parallelization, you get per-worker duration and test distribution across workers. You can spot poor load balancing, expose slow shards, and see which workers are struggling and why.
Duration and Performance Trending
You can track average runtime trends, percentage drift, and regression signals over time. This helps catch gradual performance degradation (a test whose runtime slowly creeps from two seconds to six seconds over several weeks) before it eats your CI cycle time.
Branch and PR-Level Reliability Visibility
Reliability is tracked at the branch and PR level. You can see whether instability is isolated to a feature branch, how failure rates change after a commit, and where regressions got introduced.
Alerting and Operational Signals
You can set thresholds on flakiness increases, duration spikes, or correlated failures, and get alerts when they're hit or close to being hit.
Ownership and Accountability Visibility
At scale, no single engineer can own every test. Mapping tests to teams or domains makes failures routable. When a spike hits the payments flow, the payments team gets notified automatically instead of whoever is on CI duty.
Here's how triage compares in practice between native reporting and a cross-run view:
| With Native Reporting | With Cross-Run Visibility |
|---|---|
| 1. See test failed (2 min) | 1. See failure + "Flaky: Failed 2 of last 5 runs" (1 min) |
| 2. Click to see error message (1 min) | 2. See correlation: "Tests A, B, C failed together" (1 min) |
| 3. Check if it's flaky via manual rerun (5 min) | Diagnosis: Database Lock Contention |
| 4. Compare to yesterday's report (3 min) | |
| 5. Manually search for similar failures (2 min) | |
| Total: 15 minutes to diagnosis | Total: 2 minutes to diagnosis |
Shorter triage is the obvious win. The less-obvious one is that it frees up the time needed to actually own tests.
Test Ownership and Accountability at Scale
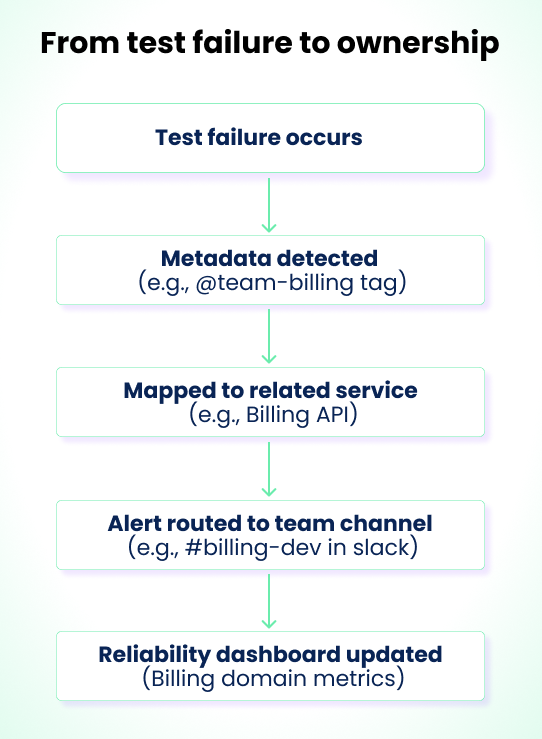
When you don't have to spend every failure wondering "is this broken or just flaky?", you have time to fix the broken ones. That's how observability tooling reinforces ownership. The tools read the metadata already in your Playwright code, tags, file paths, annotations, and automatically route failures to the right team.
As the suite grows, this is what lets you assign each test file to a team and keep that mapping coherent. Tags become dynamic routing keys. A test tagged @team-billing that fails can fire an alert into #billing-dev on Slack or Discord without a human in the loop.
Playwright supports two native ways to attach this metadata: tags in the test title (@team-billing) and declaration-level annotations. Tags work well for simple routing since they're just strings you can grep or filter on. Annotations are better when you need structured metadata (a type and description pair) that reporters can parse programmatically:
import { test } from "@playwright/test";

test(
  "billing flow",
  {
    annotation: { type: "team", description: "billing" },
  },
  async ({ page }) => {
    // ...
  },
);
Declare ownership at the test level, not at runtime with testInfo.annotations.push. Runtime annotations are meant for per-execution data (browser version, feature flag state, etc.), not static metadata that should apply to every run of the test.
In a microservices setup, you can link tests directly to the service they validate. An "Add to Cart" test might be tagged to the pricing service that calculates item prices and discounts. When it fails, the failure is associated with that service automatically.
The output is per-domain, per-team, and per-service dashboards with metrics that match how large organizations actually operate: test ownership by domain, reliability tracked per team, and dedicated owners for each slice.
Without ownership, tests keep failing, nobody is on the hook to fix them for good, builds stay red, releases slip, and instability becomes the baseline.
If you're past 50 tests, recognize the pain indicators, and don't have clear ownership, it's time to move to a dashboard that tracks runs over time.
Moving Beyond Native Reporting
The core difference between the HTML reporter and a test observability platform is persistence. The HTML reporter produces a snapshot of one run. A reporting platform stores every run and builds relationships between them: which tests fail together, which are getting slower, which started failing after a specific commit.
Technically, these platforms work by replacing or augmenting Playwright's built-in reporters. You configure a custom reporter that streams TestResult data (including the workerIndex, parallelIndex, retry, and annotations fields the HTML reporter ignores) to a backend that normalizes and stores it. From there, the platform can:
- Classify failures automatically. Parse stack traces into categories (assertion failures, timeouts, element not found, network errors) so you can filter and group failures instead of reading each one.
- Detect flakiness across runs. Compare results for the same test across multiple CI runs on the same commit SHA. A test that fails once but passes twice is flaky. A test that fails three times in a row is broken. The distinction matters for triage.
- Track duration trends. Store test durations over time and surface regressions. A test that crept from 2s to 8s over three weeks is invisible in a single-run report but obvious in a trend graph.
- Correlate failures. When five tests fail in the same run, check whether they share a tag, file, or dependency. If they all hit the same API endpoint, the problem is the endpoint, not five separate tests.
- Balance parallel execution. Use historical duration data to distribute tests across workers by expected runtime, not by count. This eliminates the bottleneck where one worker runs all the slow tests while others sit idle.
Several platforms offer these capabilities for Playwright. Currents is one example, purpose-built for Playwright's scaling problems. For a full comparison of reporting and orchestration tools, see Alternatives to Currents.
The right choice depends on whether you want self-hosted control, cloud convenience, or deep CI integration. What matters is moving from "what failed" to "what does this mean, and what should we fix first?"
Join hundreds of teams using Currents.
Trademarks and logos mentioned in this text belong to their respective owners.


