How to Track the Health of Your Playwright Test Suite
Passing tests can hide broken workflows. Understand how test automation analytics track key metrics to keep your Playwright test suite healthy.

Imagine your CI dashboard shows green with 847 passing tests. Everything looks ready for release, so you push to production. Soon after, users start reporting broken workflows and missing UI elements. The tests gave a perfect report, while the application told a different story. How does a system designed to catch problems become the very thing hiding them?
The real problem is those green checkmarks. A Playwright test suite may silently accumulate debt over time. This happens through flaky tests that pass undetected, outdated assertions that fail to catch real issues, and performance friction that gradually slows the entire development cycle.
As this debt builds, noise-filled reports bury real risks and erode team trust. Eventually, tests that feel fragile get bypassed, allowing critical regressions to reach production. For organizations, the cost is high. It shows up as wasted developer time, slower PR feedback, stalled pipelines, and higher incident in production.
In this article, we’ll look at what defines a reliable suite, the key metrics that matter most, the practices that sustain them, and how analytics translate those practices into tangible results. You’ll get a framework for using test automation analytics to keep your Playwright test suite healthy.
What Makes a Healthy Playwright Test Suite
A healthy test suite verifies expected results and issues before they reach production. Here are the key factors that define a healthy Playwright test suite.
Stability Forms the Foundation Test stability in Playwright means predictable outcomes regardless of external variables. When tests are stable, developers get reliable feedback quickly, which keeps releases on track. Implementing proper waiting strategies with explicit conditions establishes this foundation, yet many developers still rely on hard-coded delays that create unreliable results.
Consider how a minor Document Object Model (DOM) change can ripple through a test suite. Using dedicated testing attributes, such as data-testid, helps tests survive UI changes without collapsing under minor edits.
Real stability means your tests keep working as your application changes. Role locators like getByRole() are considered best practice in Playwright because they align with how users experience the UI, keeping tests valid as long as the product’s behavior remains consistent.
page.getByRole("button", { name: "Log in" });
Test Performance Impacts Everything
Performance in test automation extends far beyond execution speed. It shapes how and when they run tests. Playwright users run anywhere from a few dozen to thousands of tests across different machines. Variations in hardware and performance that don’t matter in small runs can cause entire suites to break at scale.
The deeper cost of slow tests is how they change developer behavior. A 20-minute suite discourages local runs, and hour-long feedback loops push teams toward batching changes, eroding the very speed testing should provide.
Network dependencies represent one of the most common performance killers in Playwright test suites. Tests that make real API calls create unpredictable timing, which many users only discover when scaling beyond small test suites.
Coverage Beyond Lines of Code
Traditional code coverage metrics tell you which lines your tests executed, but they reveal nothing about whether those tests validate functionality or ensure compliance. Focusing solely on coverage percentages overlooks the more fundamental question of test value.
In a healthy test suite, coverage matters most when it validates real user journeys. Achieving 90% code coverage by testing every branch of authentication is less valuable than ensuring users can log in and access resources. Tests should reflect how the product is actually used in real-world scenarios.
To capture this, teams can measure feature or requirement coverage by tracking which business-critical features and acceptance criteria their tests actually cover. This gives a clearer view of how well the suite supports actual user outcomes, not just source lines. An example might look like this:
// @ts-check
const { test, expect } = require("@playwright/test");
test("user can complete checkout workflow", async ({ page }) => {
  // Add item to cart
  await page.goto("https://example.com/products/laptop");
  await page.getByRole("button", { name: "Add to Cart" }).click();

  // Proceed to checkout
  await page.getByRole("link", { name: "Cart" }).click();
  await page.getByRole("button", { name: "Checkout" }).click();

  // Verify order confirmation
  await expect(
    page.getByRole("heading", { name: "Order Confirmed" })
  ).toBeVisible();
});
Maintainability Determines Longevity
Test maintainability is measured by how much effort it takes to keep tests running as the codebase changes. Best practices call for tests that don’t depend on one another, though some duplication is acceptable when tests are simple enough.
The Page Object Model represents one approach to maintainability, but it can become a maintenance burden if not implemented thoughtfully. Organizing tests using the Page Object Model and optimizing performance helps build a resilient Playwright test suite that delivers high-quality, maintainable tests.
Observability Reveals Hidden Problems
In Playwright, test observability goes beyond pass/fail checks and focuses on understanding how your tests behave. Developers can identify the exact cause of test failures and check the execution flow step-by-step to determine the precise point where an error occurs.
The Playwright Trace Viewer captures screenshots, DOM snapshots, and network activity for individual test runs, helping teams diagnose specific failures faster. Teams using it find root causes drastically faster than traditional debugging. One QA lead reported cutting debugging time by 80% after adopting traces.
Here’s what a typical action snapshot looks like:
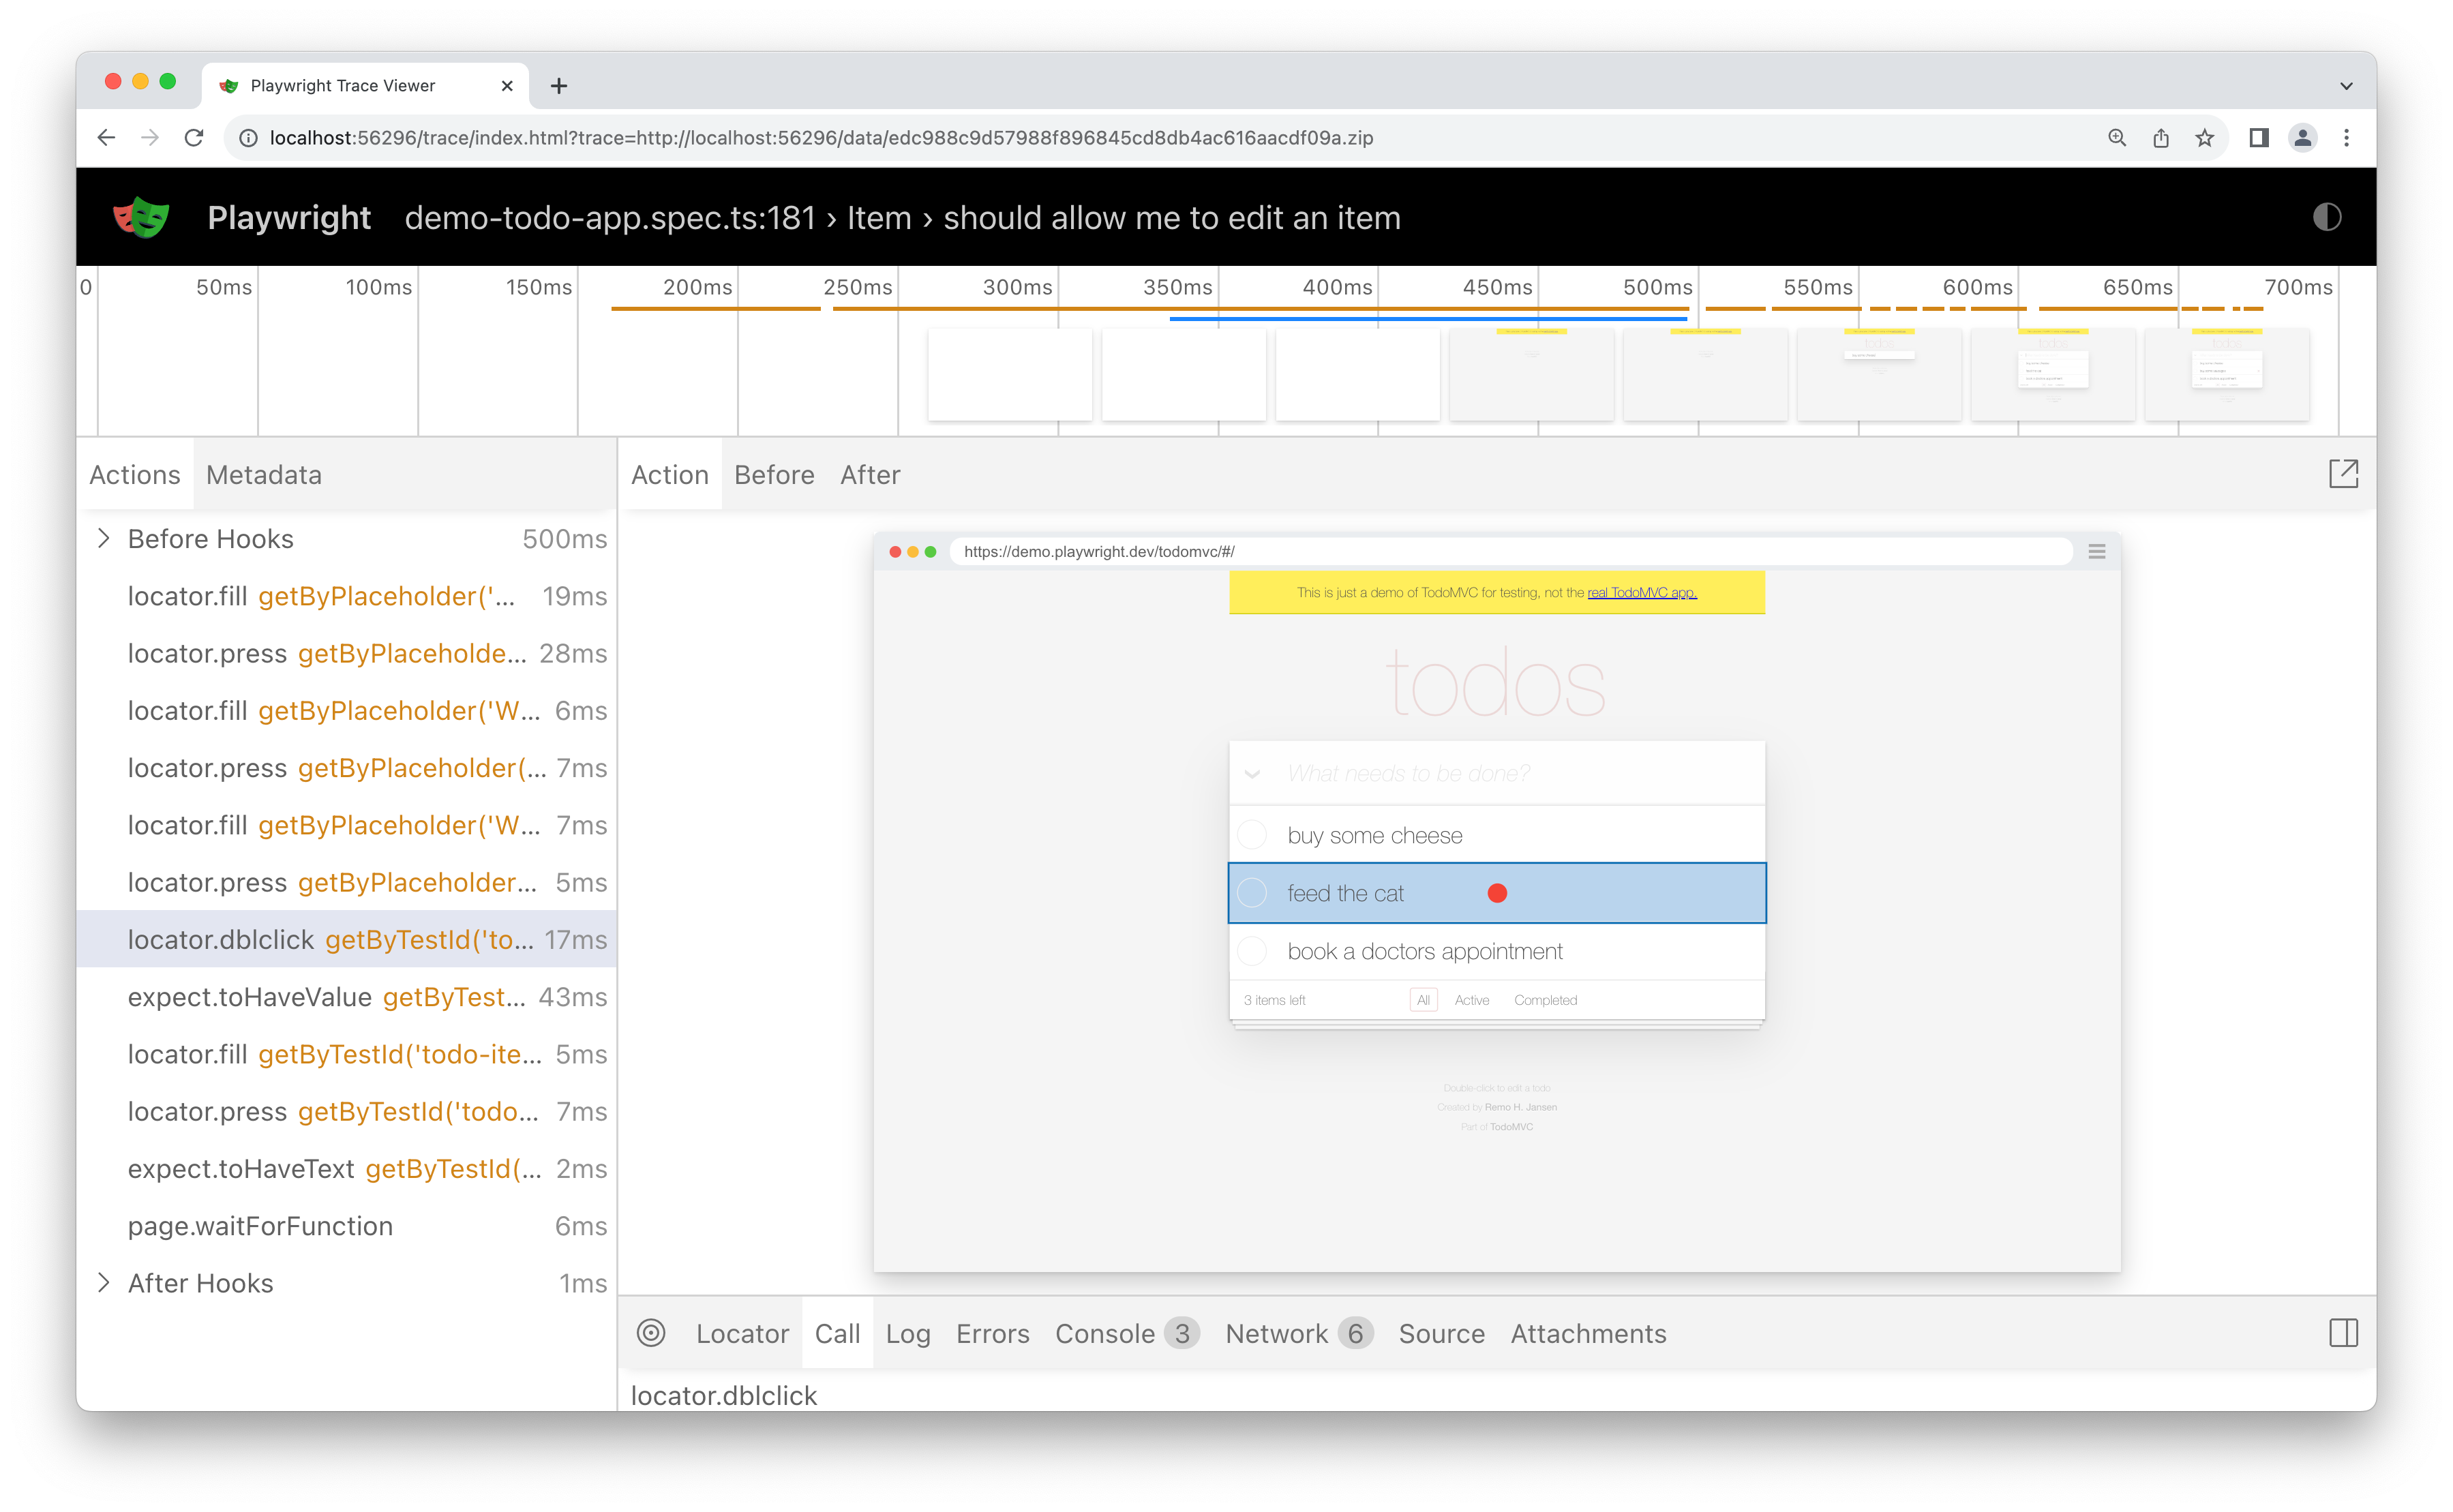
However, the trace viewer only works per run. To have a clearer viewer of aggregated metrics, using a modern test observability tool is recommended to capture the whole story, making error analysis more manageable.
Isolation Prevents Cascading Failures
Test isolation means each test runs completely independently from one another, with their own local storage, session storage, cookies, and other state. Tests written with Playwright execute in isolated, clean-slate environments called browser contexts, which prevents cascading test failures.
Poor isolation creates hidden dependencies where Test A silently sets conditions that Test B relies on. When A changes or fails, B starts failing too. These cascading failures waste huge amounts of debugging time because the root cause lies outside the failing test.
Effective isolation relies on disciplined test design. Each test should manage its own setup, avoid shared state, and work regardless of execution order.
A simple example showing test isolation in Playwright:
import { test, expect } from "@playwright/test";
test("isolated test example", async ({ browser }) => {
  const context = await browser.newContext(); // creates a clean, isolated context
  const page = await context.newPage();
  await page.goto("https://example.com");
  await expect(page).toHaveTitle("Example Domain");
});
With the design in place, the next step is measuring whether the suite performs as expected.
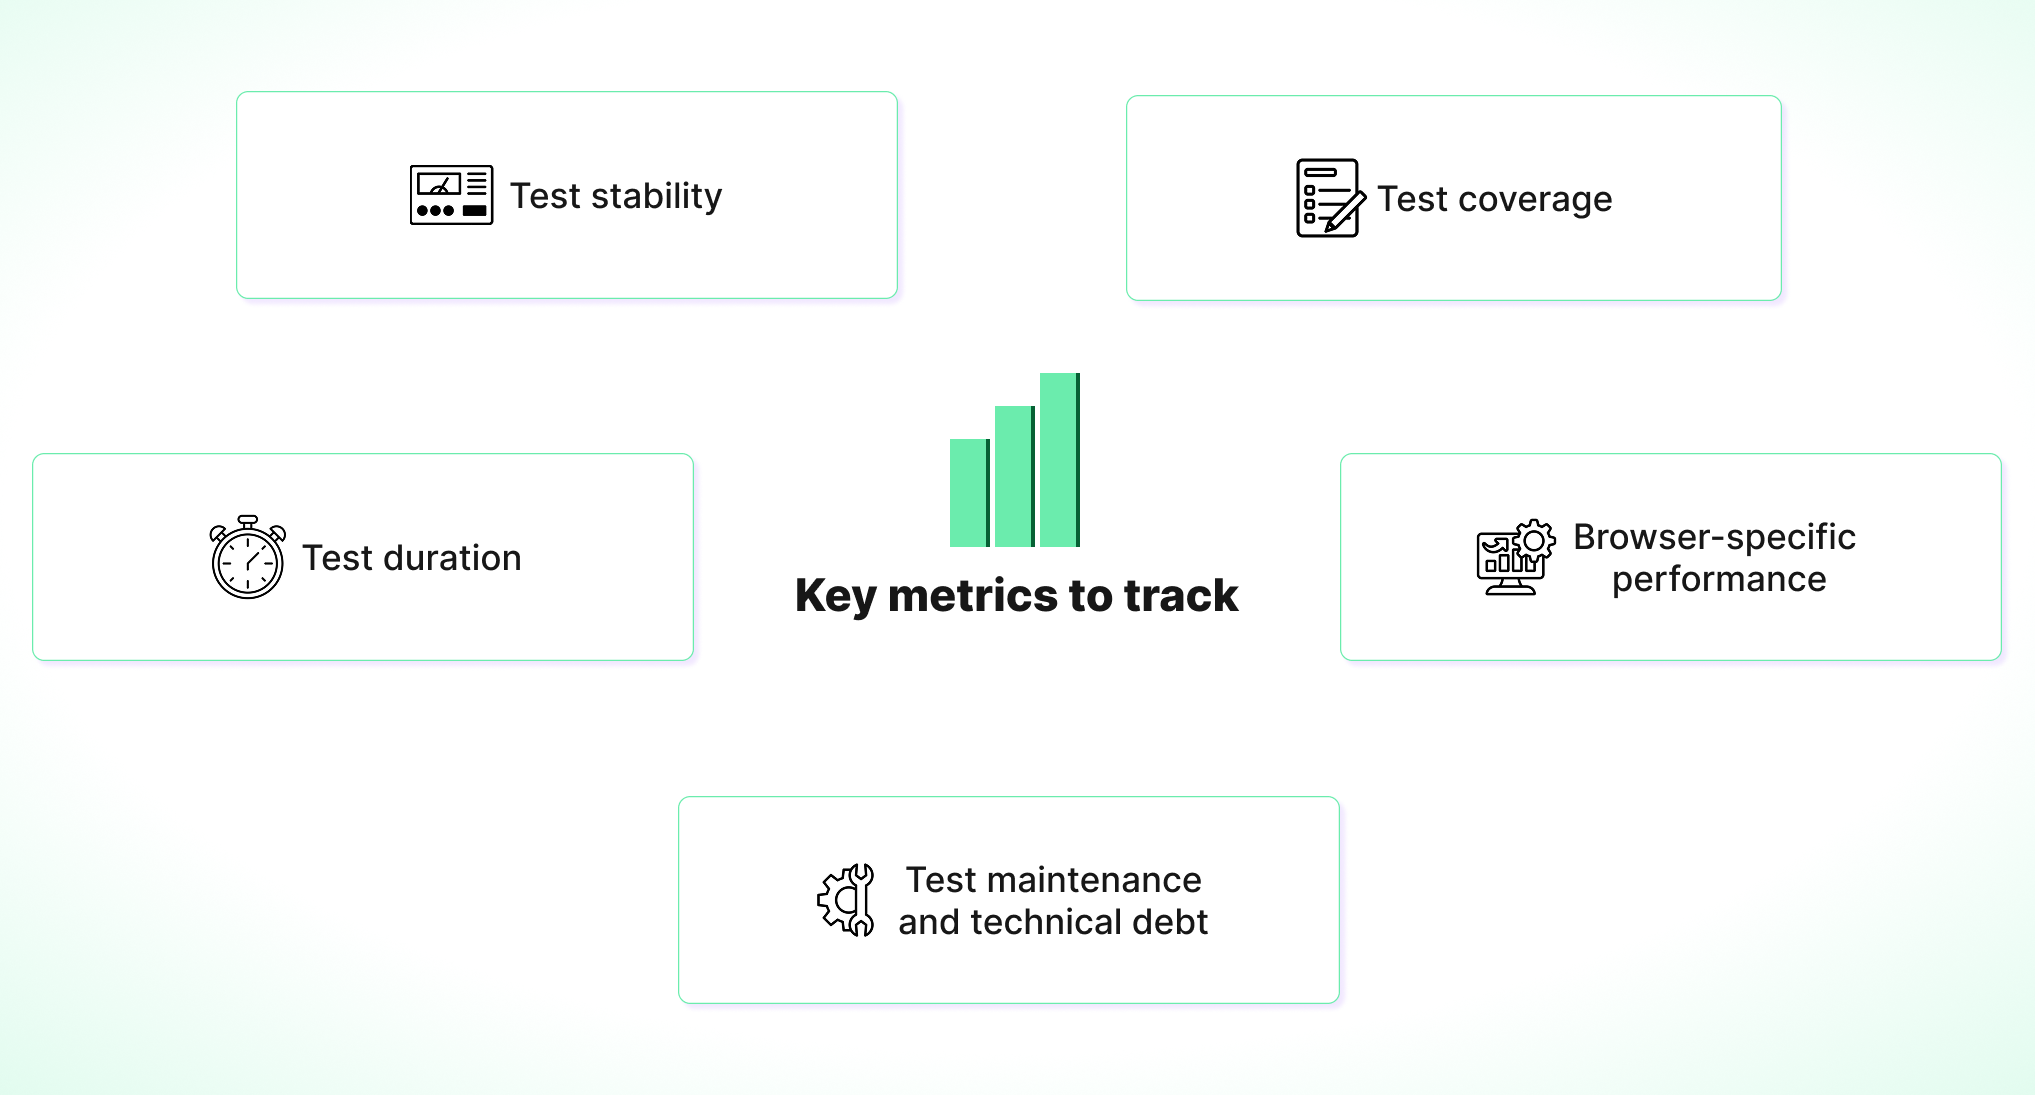
Key Metrics to Measure Playwright Test Suite Health
Measuring test suite health begins with understanding which metrics are most important. Some key metrics to monitor for a healthy Playwright suite include:
Measuring Test Stability
You can't maintain a healthy test suite without stability. When tests behave unpredictably, teams stop trusting their automation. Flaky tests are usually to blame.
Flaky tests are those that pass one run and fail the next without code changes, creating false positives and negatives that waste time and hurt team morale. A 5% failure rate may look small, but it leads teams to ignore failed builds and bypass CI checks.
Tools like Currents help here by tracking duration, failure rate, and flakiness for every test, highlighting trends that are often overlooked by pass/fail metrics. Some failures aren't even code-related but come from external factors, such as connectivity or interface glitches.
The signals worth watching include:
- Failure frequency per test over rolling windows
- Retry success rates
- Failure clustering by browser or time
- Flakiness rate
Playwright also provides a built-in way to handle flaky automated tests directly in your test code. For example, you can retry tests within a describe block using test.describe.configure({ retries: 2 });
import { test, expect } from "@playwright/test";

test.describe(() => {
  // All tests in this describe group will get 2 retry attempts.
  test.describe.configure({ retries: 2 });

  test("test 1", async ({ page }) => {
    // ...
  });

  test("test 2", async ({ page }) => {
    // ...
  });
});
Test Coverage: Beyond the Numbers
Traditional code coverage metrics track which lines of code your tests executed, providing a baseline view of test reach across your codebase. However, these metrics miss the point in end-to-end testing (e2e). Playwright doesn’t provide built-in e2e coverage tracking, though demand from the community highlights its importance.
The objective measure of coverage lies in validating actual workflows rather than just utility functions. Some key workflows include:
- Checkout flows
- Login
- Error recovery
- Mobile responsiveness
How teams validate workflow coverage:
Map tests to your critical user journeys. For checkout, that means product selection, shipping information, payment processing, and order confirmation. If your checkout test calls payment APIs directly without touching the cart UI or confirmation screens, you've found a gap.
Use instrumentation to validate execution paths. Add logging that tracks which UI components render and which API endpoints get called. If a login test shows 80% code coverage but instrumentation reveals it never rendered the login form or handled session storage, the coverage metric misleads you.
Validate with your team. In code reviews, ask: "What user journey does this test prove works?" If the answer is "it tests the payment processor" rather than "it proves users can complete checkout end-to-end," you're testing implementation details instead of workflows.
Test Duration: Performance Under Pressure
Tracking test execution time helps identify slow tests and performance constraints that compound across large test suites. A test that runs 30 seconds longer than expected may seem minor, but across hundreds of parallel executions in CI/CD pipelines, the delay quickly adds up.
Patterns in test duration can expose hidden issues, such as:
- Database slowdowns
- CI hardware hitting its limits as the test suite scales.
- Selectors that grow inefficiently as applications expand
The clearest signals come from linking execution time changes to deployments. Test execution and page load times tracked for every test can reveal performance regressions that traditional application monitoring often misses. Functional tests catch bugs, but performance regressions like slower response times or reduced throughput are harder to detect automatically.
Monitoring test duration highlights these issues. For example, If your checkout flow test normally runs in 12 seconds but suddenly takes 45 seconds after a deployment, that's a signal. The application still works, but performance has regressed.
Browser-Specific Performance Metrics
Playwright's cross-browser capabilities address the complexity in performance measurement. Tests might execute efficiently in Chromium while experiencing timeout issues in Firefox or Safari, highlighting the need to track performance across multiple browser engines to capture real user experience issues.
Because resource usage and behavior vary between browsers, a test suite that performs well overall might still struggle with memory leaks or rendering delays that are only apparent under specific engines.
By examining browser-specific insights, development teams can prioritize optimizations and shape strategies without slowing down coverage. One practical way to handle this is by defining multiple browsers in the test configurations:
// playwright.config.js
import { defineConfig, devices } from "@playwright/test";

export default defineConfig({
  projects: [
    { name: "Chromium", use: { ...devices["Desktop Chrome"] } },
    { name: "Firefox", use: { ...devices["Desktop Firefox"] } },
    { name: "WebKit", use: { ...devices["Desktop Safari"] } },
  ],
});
Test Maintenance and Technical Debt
Maintenance and development of test automation tools commonly encounter problems due to unforeseen obstacles, creating technical debt that accumulates silently until productivity grinds to a halt. This debt manifests as increased time spent updating tests and working around unstable test behaviors.
One way to detect this debt is by monitoring metrics like flakiness rate, failure rate, and rerun frequency after minor updates, and by surveying engineers or Software Development Engineers in Test (SDETs) about their confidence in and perception of the test suite. Gathering feedback directly from the team provides valuable insight into the overall sentiment and health of the test suite.
The hidden tax of this debt also appears in developer context switching, which pulls attention away from actual product development. Taking proactive steps can help prevent these challenges from accumulating.
Best Practices to Keep Your Test Suite Healthy
Tracking metrics is just the first step. Below are practical practices teams can follow to maintain a healthy Playwright test suite.
Set Clear Flakiness Benchmarks
Most teams only react once the suite collapses, and by then the damage is already done.
Start by setting clear expectations by defining acceptable failure upfront and avoiding masking issues with silent retries.
Next, detect and address instability. Re-run tests across environments to identify fragile tests. Use retries cautiously and focus on resolving the root causes instead of rerunning failed tasks.
Finally, establish measurable targets. Keep flakiness below 1%, investigate repeated failures, and act immediately when failure rates spike.
Regular Test Suite Pruning
Old tests that nobody uses often pile up, slowing builds, wasting resources, and creating extra maintenance work.
To address this, review suites on a regular basis. Remove tests tied to rolled-back or deprecated features, and archive those without value.
Finding what to delete is straightforward. Getting the team on board is the real challenge. Still, dead tests provide zero coverage for living software. Pruning isn’t just about cleanliness. It helps cut CI costs, keeps feedback loops fast, and frees developers from spending time on tests that no longer add value.
Automate Health Monitoring
Manual monitoring doesn’t scale. To maintain reliability at scale, automation is crucial for detecting flaky tests, analyzing coverage, and sustaining long-term suite health. Dashboards play a key role in this automation by tracking regression trends, flakiness rates, and increasing runtimes across test runs.
When flaky tests appear, act immediately. Fix or tag them to maintain accurate results and give the team certainty.
Set up practical alerts. Trigger notifications for long builds or repeated failures to ensure problems are addressed before they impact development.
Implement Robust Waiting Strategies
Arbitrary timeouts are unreliable because they may fail on slower systems or be unnecessarily long on faster ones.
To handle this, use auto-retrying assertions, such as toBeVisible(). These configure Playwright to automatically wait for the expected condition to be fulfilled or until a timeout occurs, reducing test flakiness caused by network delays or slow responses, while also cutting down unnecessary wait times in CI pipelines.
Avoid fixed delays, as they can lead to unreliable tests. Instead, use Playwright's waiting mechanisms, such as waitFor(), rather than assuming that a fixed 5000 milliseconds will be sufficient. With proper waiting strategies in place, the next step is understanding the suite’s behavior over time.
→ Debugging Playwright Timeouts: A Practical Checklist
How Test Automation Analytics Support Test Suite Health
Test automation analytics give teams the clear insight into test and failure patterns, helping them improve test reliability. Let's look at how analytics contribute to stronger suite health.
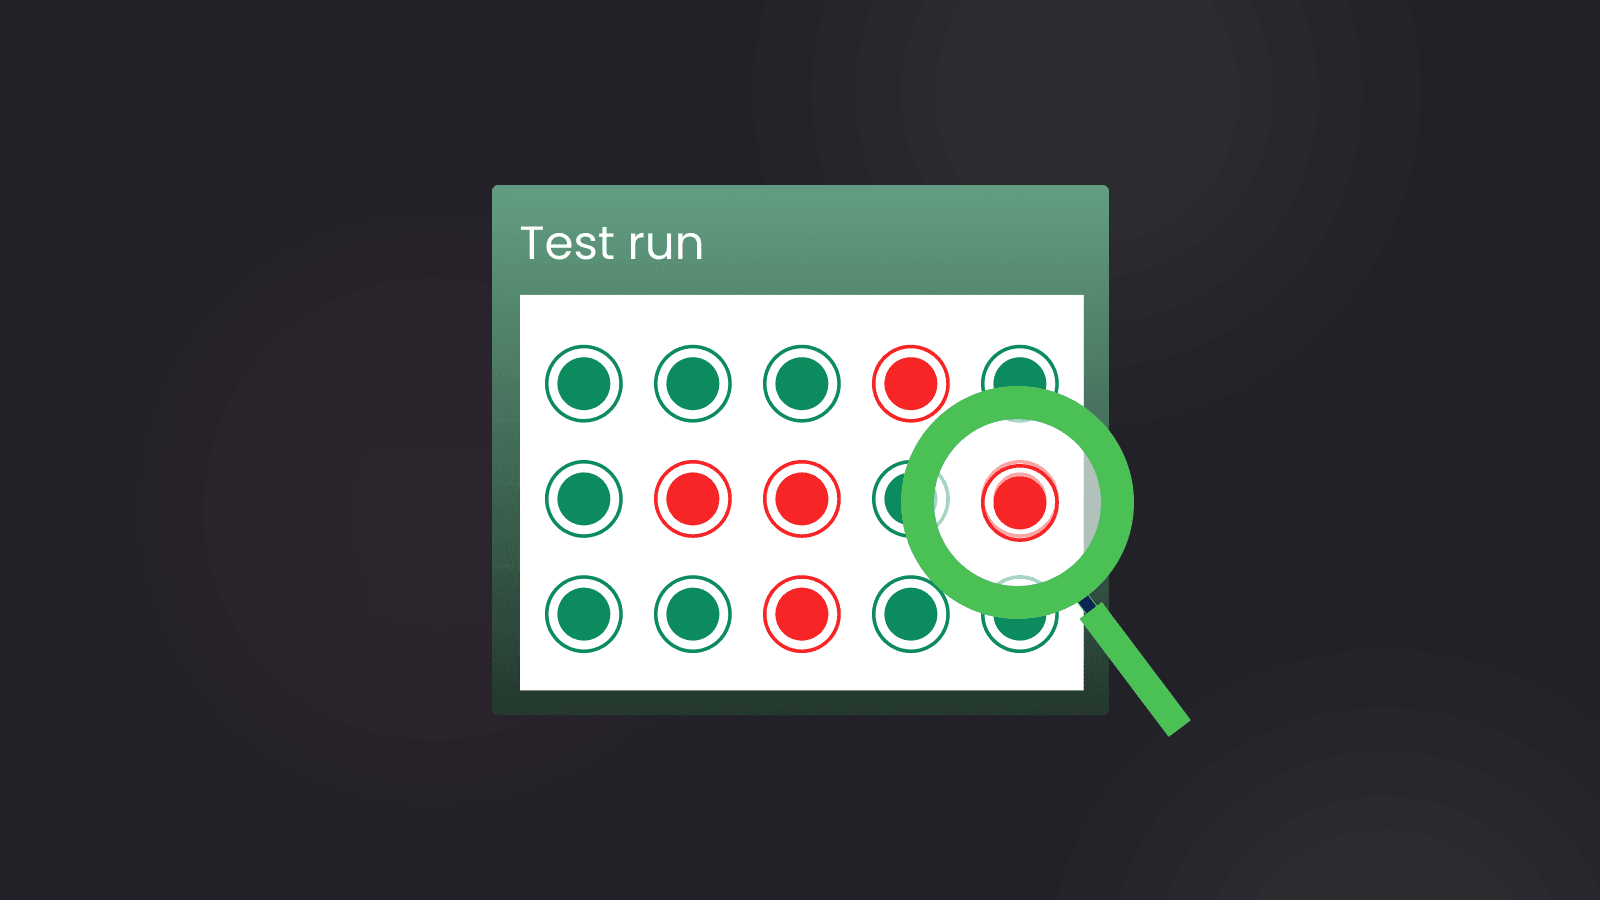
The Dashboard Paradox
Traditional test reporting focuses on individual runs rather than patterns over time. Playwright HTML reports show only the last execution and don’t reveal whether failures are isolated or part of emerging trends.
Dashboards alone don’t reveal why tests fail or how to prevent future problems. Even a test passing 95% of the time can drain resources if failures occur during critical deployment windows. Teams need information that connects test behavior to practical improvements.
From Raw Results to Meaningful Patterns
Playwright generates detailed execution data, including traces, screenshots, console logs, and network activity from distributed shards. This helps teams troubleshoot failed and flaky tests and gain practical visibility beyond individual runs.
Linking test results to deployments, feature releases, and infrastructure changes exposes integration issues that aggregate statistics overlook. Teams often find that "flaky" tests are not random and fail predictably under certain conditions.
Context turns data into action. Analytics platforms correlate test behavior with developer activities, revealing cause-and-effect relationships that manual analysis overlooks.
Turning Data into Decisions
The gap between collecting metrics and acting on them destroys most test health initiatives. Real progress comes from closing the loop through analytics automation. Tools that connect to your CI pipeline can analyze every run, giving QA and dev teams faster ways to spot failures and flakiness. This form of process automation reduces human error and turns reactive debugging into proactive maintenance. Advanced data analytics platforms take it further by detecting recurring failure patterns. The system automatically flags identical patterns and delivers actionable insights to improve the process.
Integration with Development Workflow
The most effective test analytics appear at key decision points: pull request checks, deployment approvals, and sprint planning. Developers and deployment teams can view test health trends for affected components and key workflows without manual data preparation or correlating reports. With this information, teams catch issues early and prevent bad code from reaching production.
Integration with platforms like GitHub Actions or GitLab CI ensures that health data informs decisions about deployment timing and resource allocation.
Historical Context and Trend Analysis
Trend analysis helps teams spot accumulating test maintenance debt before it becomes overwhelming. Rising execution times, failure rates, or retry attempts all signal developing problems that single-run reporting doesn’t capture.
Historical insights reveal which code changes leads to higher maintenance costs, helping teams decide on test architecture and how to plan future development.
Final Thoughts
Test suite health is an ongoing discipline that helps engineering teams identify problems early. The real goal is to build systems that catch issues before they escalate.
Currents provides the analytics to turn your Playwright suite into a reliable safety net. Start with the metrics that matter, expand as patterns emerge, and strengthen your suite’s health.
Join hundreds of teams using Currents.
Trademarks and logos mentioned in this text belong to their respective owners.