How To Debug Playwright Tests in CI: The Complete Guide
Struggling with Playwright tests failing only in CI? Here's how to debug them with tracing, verbose logs, and consistent environments to find the root cause.

Continuous Integration (CI) environments often expose issues that never appear during local runs. A suite of Playwright tests may pass flawlessly on a workstation, yet surface failures once pushed into a shared pipeline.
Differences in execution speed, browser behavior, environment variables, and CI resource limits (like CPU throttling, shared runners, and constrained memory) create gaps that are difficult to trace. With limited visibility and high parallelism, pipelines can make small timing issues look unpredictable. Debugging in this environment requires clarity, structure, and the right combination of tooling.
This guide explores the conditions that cause Playwright tests to fail in CI pipelines, along with practical debugging techniques that help restore stability.
Understanding CI Flakiness Types
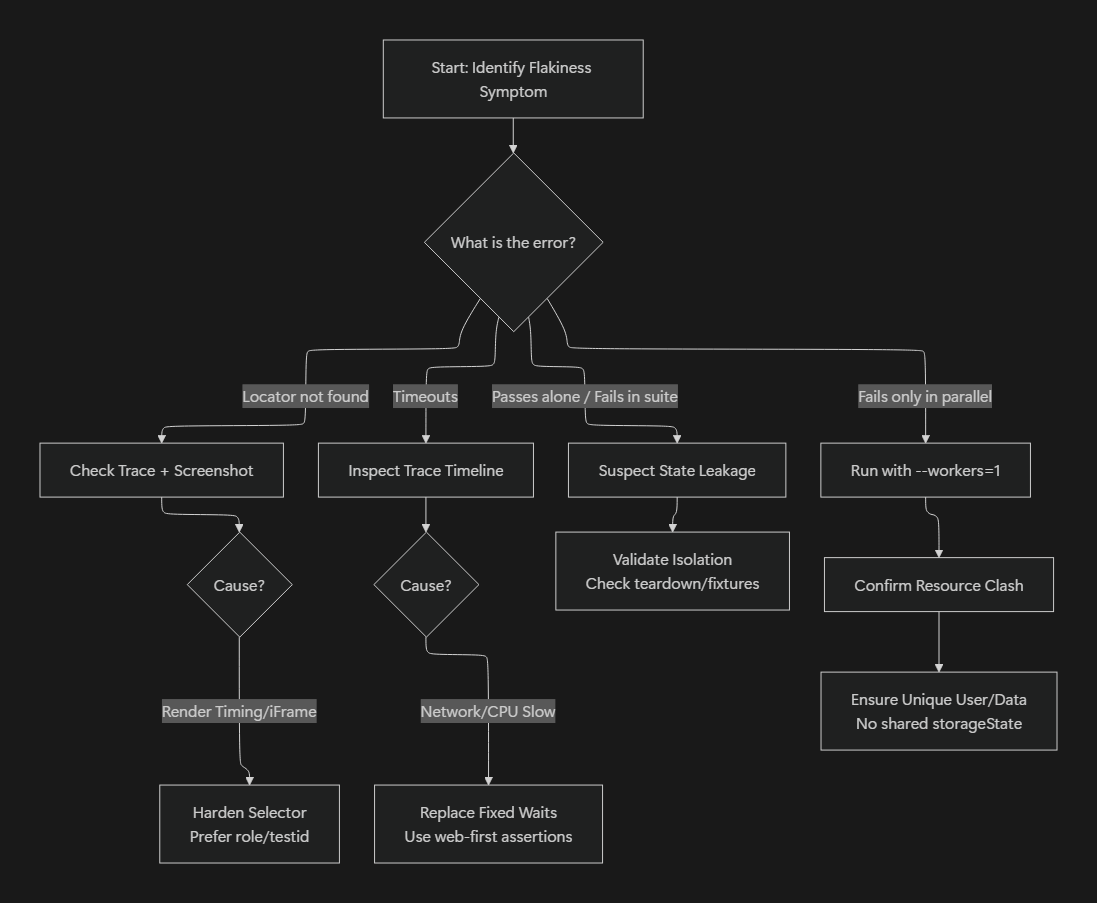
Most CI failures fall into a small number of categories, and identifying which category you’re dealing with is often more important than the specific error message.
- UI-driven flakiness: timing issues, missing waits, animations, or dynamic rendering differences.
- Environment-driven flakiness: slower CPUs, constrained memory, containerization, or network latency in CI.
- Data and parallelism-driven flakiness: shared backend data, reused accounts, or unsafe storageState usage across workers.
- Test-suite-driven flakiness: leaked state, shared fixtures, order dependencies, or architectural issues within the test code itself.
Effective CI debugging starts by determining which category a failure belongs to, since each requires a different remediation strategy.
Why Playwright Test Runs Behave Differently in CI
Automated tests frequently destabilize in CI pipelines due to the resource limitations of shared runners, where restricted CPU and memory alter browser timing and event scheduling. Unlike local environments that typically benefit from cached assets and existing sessions, CI typically runs with a "cold" browser launch that ruthlessly exposes missing waits and fragile timing assumptions previously hidden on warmed machines. This complexity is exacerbated by headless execution and environmental drift, which remove the visual cues necessary for straightforward diagnosis. Beyond individual browser performance, parallelism amplifies instability. While developers often test sequentially, CI pipelines run multiple workers simultaneously, leading to cross-test collisions where workers race for session tokens or corrupt shared backend data. Finally, the pipeline's network environment acts as a rigorous stress test: higher latency reveals unhandled API delays, while stricter firewalls may unexpectedly block third-party scripts, breaking UI dependencies that function flawlessly during local development.
Let’s get into how to debug Playwright tests in CI.
Improving Visibility in CI Test Failures
A frequent case involves a checkout test that stops midway in CI without clear feedback. For example, the test might click "Proceed to Payment" but the pipeline logs simply show that the action executed, nothing more. Locally, the next page loads instantly, but in CI the app may still be rendering, waiting on a slow API response, or recalculating layout under reduced CPU. With no trace or visual output enabled, the run appears to freeze, giving you no indication of whether the page navigated, the button fired, or the element was never visible in the first place.
The output log shows the action where it stopped, but nothing indicates which condition prevented the test from advancing. The root problem lies in insufficient visibility. While Playwright offers rich tracing and logging tools, they must be explicitly enabled during test execution for pipelines to collect the necessary details.
The immediate improvement comes from enabling trace recording. Traces create a visual timeline of the test’s progress, including screenshots, events, and console logs. Once enabled, pipelines can store the generated trace file for later inspection. Developers reviewing the failure can load that file into the trace viewer to see the exact moment the issue occurred.
A typical configuration:
// playwright.config.ts
import { defineConfig } from "@playwright/test";

export default defineConfig({
  use: {
    trace: "on-first-retry",
    video: "retain-on-failure",
    screenshot: "only-on-failure",
  },
});
Running the code below ensures that traces and videos for failing runs appear in the test results directory:
npx playwright test
Opening them in the trace viewer helps clarify which actions completed successfully and which failed due to missing locators, slow load times, or unexpected UI changes. Keep in mind that retries can hide systemic flakiness rather than resolve it. Retries are most useful for diagnosing failures (for example, capturing traces on first retry), not for stabilizing inherently unstable tests. If a test passes on retry but fails intermittently, the root cause is around missing synchronization, shared state, or nondeterministic data and not insufficient time.
Playwright traces are powerful but heavy (large files that slow down pipelines and make manual artifact handling painful at scale). Currents centralizes traces and videos across CI runs, removing the need to download artifacts locally and making it easier to compare failures over time without incurring repeated CI overhead.
Using Playwright Verbose Logging to Understand Hidden Conditions
A test fails instantly in CI with a generic "locator not found" message, but provides no indication of what led to the failure. The underlying issue is that the pipeline hides low-level debugging detail by default. The debugging process requires better output.
Activating verbose output reveals API activity, locator resolutions, and execution reasoning inside the Playwright test runner. Logging lines also show retry attempts and timing behavior, which helps identify whether a locator resolved correctly but appeared too late.
This logging mode can be activated through environment variables:
DEBUG=pw:api npx playwright test
exposing logging for the test flow. Output also helps when analyzing API logs, making it easier to follow each network action. Keep in mind that verbose logging doesn’t follow network action by default; additional setup is required.
DEBUG=pw:api is useful for understanding why Playwright made a decision (timeouts, waits, locator resolution).
DEBUG=pw:browser* exposes low-level DevTools protocol traffic, which is mostly useful for framework-level debugging or rare edge cases (frames, navigations, cross-origin issues).
For CI debugging, Playwright traces and HAR files are almost always more actionable than browser protocol logs.
Verbose logs provide depth into Playwright’s execution flow, but they do not expose CI-specific constraints such as resource contention, containerization, or shared runner behavior. To surface CI-only failures, you need to replicate those conditions directly.
Simulating CI Conditions Locally
A common obstacle arises when a test passes locally but fails repeatedly in CI, even when tracing is enabled. The reason often lies in execution differences that only appear under CI constraints. To reproduce these conditions, the environment needs to run locally with similar settings. This includes using full headless mode, limiting CPU, or mimicking environment variables used by pipelines.
Teams can match CI behavior by running:
# Normal local run
npx playwright test

# Simulate CI behavior locally
CI=true npx playwright test
Setting CI=true alone does not reproduce real CI conditions. It only affects behavior if your test harness or scripts explicitly depend on this variable. Accurate CI reproduction requires running tests in the same container image, with matching browser binaries, OS-level dependencies, and comparable CPU and memory constraints.
This reveals timing drifts, subtle animations, or layout adjustments that otherwise remain hidden. Running tests under constrained CPU also exposes flaky steps that rely on speed. Local simulation should mirror how tests are executed in CI, including environment variables, test commands, and configuration. Keeping configuration consistent across environments reduces the complexity of reproducing failures. However, environment alignment only gets you so far. Intermittent or timing-sensitive failures require deeper, interactive debugging.
Deep Debugging with the Playwright Inspector Tool
The Playwright Inspector is a local debugging tool and cannot be used interactively inside CI (reproduce locally in a CI-matching container and run headed + slowMo + video to get CI-like visual debugging after pulling the same commit/env). It becomes useful only after a CI failure has been reproduced locally under comparable conditions. A scenario involving a booking form might pass most of the time, but fail intermittently in the pipeline. When inspecting the failure, the locator appears correct, yet the test still misses the expected element. The deeper issue typically relates to timing or animation state. Inspecting the test step-by-step helps determine the exact cause.
Launching tests in inspector mode reveals the internal flow:
npx playwright test --debug
This activates debug mode and opens the Playwright Inspector, which pauses execution at the beginning of the test and before each step, so you can walk through the flow interactively and inspect the DOM, selectors, and state as the test progresses. The interface highlights selectors, DOM relationships, and execution steps. Running tests in this mode allows the suite to pause at key moments, giving insight into rendering behavior or asynchronous timing issues.
Using a GUI (Graphical User Interface) tool or the integrated VS Code extension for Playwright further assists by visualizing each state transition. Tools like the Playwright Inspector let you step through actions interactively, inspect the DOM at each pause, confirm whether locators actually match what you expect, and observe timing behavior that is usually invisible in CI. This makes it much easier to spot missing waits, unstable selectors, or dynamic UI changes that only manifest under CI constraints.
After gaining visibility into the test flow, the focus shifts to reducing iteration cost during debugging.
Re-Running Isolated Scenarios for Faster Iteration
In the situation where only one flow in a larger suite becomes unstable in CI, running the entire suite repeatedly slows down the investigation and consumes pipeline resources. The key is to isolate the failing section and target it directly.
Playwright supports narrowing runs to a specific test or a single test file. This allows a tighter focus and faster feedback.
For example:
npx playwright test tests/checkout.spec.ts --project=chromium
To isolate a behavior or pattern:
npx playwright test --grep "checkout"
This approach keeps pipeline runs efficient and avoids re-running unaffected sections. It helps uncover patterns in test failures, especially when working across different browsers or configurations.
Playwright also supports test annotations and tags, which allow teams to classify and selectively execute tests without restructuring files. Tags are especially useful in CI pipelines, where you may want to isolate flaky tests, slow flows, or CI-only diagnostics.
For example:
test("checkout flow", { tag: "@checkout" }, async ({ page }) => {
  // test logic
});
CI runs can then target specific subsets:
npx playwright test --grep @checkout
Tags reduce iteration time during CI debugging and make it easier to rerun only the tests relevant to a failure without modifying the suite structure.
Debugging Browser/Config Mismatches Between Local and CI
A common scenario involves a navigation sequence working in WebKit but failing in Chromium, or vice versa. These discrepancies often stem from deeper differences in browser engines — such as event sequencing, focus management, timing of layout recalculations, or even browser-specific quirks and bugs that only surface under load.
First, verify you’re running the same --project locally as CI (and the same Playwright/browser versions), then compare engines only if CI runs multiple browsers.
CI environments amplify these differences because cold starts, slower CPU, and parallelism make timing-sensitive behavior more pronounced.
Testing across multiple browsers makes these issues easier to diagnose:
npx playwright test --project=webkit
Running the same flow across engines exposes subtle mismatches in behavior that may not appear in your primary browser. Understanding these distinctions helps teams adopt more resilient selector strategies and state-based waits that work consistently across all browser channels. CI-only browser discrepancies are often caused by mismatched Playwright or browser versions rather than true engine differences, making version pinning and consistent browser installation critical.
Make UI Interactions CI-Resilient
Actions + assertions over manual waits
Many modern applications use dynamic content. When CI fails to recognize newly injected components, the issue often comes from delayed visibility or elements shifting during transitions. Instead of relying on manual wait calls, Playwright encourages an actions + assertions pattern, where both behaviors include built-in auto-waiting.
For example:
await page.getByRole("button", { name: "Continue" }).click();
await expect(
  page.getByRole("heading", { name: "Payment Details" }),
).toBeVisible();
Here, the click will automatically wait until the button is actionable, and the assertion will automatically wait until the next screen is visible. This pattern handles UI timing differences more reliably than fixed waits or manual waitFor() calls, and it adapts naturally to slower CI environments.
Semantic selectors over CSS chains.
Many CI-only failures come from brittle selectors rather than timing. Playwright encourages role-based and semantic selectors instead of deep CSS paths. Prefer getByRole, getByTestId, getByLabel, or getByPlaceholder over brittle chains like div > span:nth-child(2).
For example:
// fragile
await page.click("button.btn-primary");

// more resilient
await page.getByRole("button", { name: "Continue" }).click();
Strong selectors make tests far less sensitive to layout changes, minor style refactors, and rendering differences in CI. Semantic selectors such as getByRole, getByLabel, and getByTestIdremain stable across browsers, environments, and UI variations, which makes them significantly more reliable than brittle CSS chains when running under CI constraints.
Advanced Techniques For Debugging Tests
Some CI failures remain difficult to diagnose even after analyzing traces, verbose output, and browser differences.
These failures often arise from deeper issues within the application stack, UI framework behavior, or resource patterns that require more specialized techniques. Most issues revealed by CI, including timing delays, brittle selectors, unhandled dynamic content, or unstable network dependencies, surface cleanly once you refine waits, stabilize selectors, and stub external APIs.
But when a test still fails unpredictably after all of that, the problem often isn’t the UI or the network. It’s the test suite itself. These deeper failures usually point to hidden interactions between tests, issues that only appear when tests run together instead of individually. When these tools aren’t enough, here’s what to look at:
Using Isolation Diagnostics to Detect State Leaks
A recurring scenario involves tests passing individually but failing when executed alongside others. The failure disappears when tests run in isolation but reappears when the suite runs as a whole.
This usually indicates state leakage. Even small amounts of shared state between tests (cookies, localStorage, global fixtures, or in-memory variables) can create cascading failures. Leakage becomes especially visible in CI, where the environment resets between jobs but not between tests within a single job.
A misconfigured fixture or shared object can persist across test boundaries, causing a failure only after preceding tests modify a stateful object.
Verify that your test setup has not overridden Playwright Test’s default isolation behavior. By default, Playwright creates a fresh browser context per test; CI-only state leaks usually come from shared fixtures, reused pages, global setup artifacts, or backend-side shared data.
Ensuring isolation means validating fixture boundaries, avoiding shared mutable objects, and preventing backend test data collisions, rather than manually creating contexts inside tests.
State leaks aren’t limited to the browser layer; backend and database resources can also drift between tests. Shared user accounts, reused test data, or parallel workers modifying the same records often produce CI-only failures because concurrency amplifies the interference. If one test updates a profile, toggles a feature flag, or clears a cart, another test may unknowingly inherit that mutated state.
Revealing Hidden Race Conditions Using Playwright Event Logging
Some failures occur when the UI fires multiple events in quick succession, creating race conditions that remain invisible during local runs. CI timing differences often magnify these races. A component may attach handlers in a slightly different order, or a loading indicator might disappear earlier than expected.
Adding event listeners clarifies these issues:
page.on("console", (msg) => console.log("CONSOLE:", msg.text()));
page.on("pageerror", (err) => console.error("PAGE ERROR:", err));
page.on("requestfailed", (req) => console.error("REQUEST FAILED:", req.url()));

page.on("frameattached", (frame) => console.log("FRAME ATTACHED", frame.url()));
page.on("framenavigated", (frame) =>
  console.log("FRAME NAVIGATED", frame.url()),
);
page.on("load", () => console.log("PAGE LOADED"));
These logs show whether UI events fire too early, scripts crash silently, or network dependencies fail unexpectedly. Seeing the event timeline helps pinpoint the exact moment where UI timing diverges.
Stabilizing Complex UI State with Custom Wait Conditions
Built-in Playwright waiters work well for most scenarios, but some applications use complex state transitions that require more explicit checks. When running in CI, these transitions may complete more slowly, causing elements to appear in stages.
Custom waits align the test flow with actual application conditions:
await page.waitForFunction(() => {
  const cart = document.querySelector("#cart");
  return cart && cart.children.length > 0;
});
While useful in cases involving multi-stage loaders or complex asynchronous hydration, these waits should remain the exception, not the default.
Overusing waitForFunction can make tests brittle, harder to debug, and more sensitive to timing variability — especially in CI. Prefer built-in auto-waits and assertions whenever possible, and reserve custom waits only for scenarios where the UI exposes no reliable state signal.
Using Consistent Viewports and Device Scale Factors
Failures sometimes arise because CI uses different screen resolutions or DPI settings. UI also tends to look different in CI because pipelines often run with lower resolutions, unusual aspect ratios, or different device scale factors. These differences can shift layouts enough to break selectors that pass locally.
Defining a consistent viewport ensures both local and CI environments render the application in the same way, reducing unexpected visual or layout-driven failures. Responsive layouts react differently under these conditions, shifting elements or altering visibility.
Defining consistent viewports:
use: {
  viewport: { width: 1280, height: 720 },
  deviceScaleFactor: 1
}
This removes variability and helps ensure consistent rendering.
Using Network Stubbing for Unstable External APIs
External dependencies introduce risk. Rate limits, slow responses, or inconsistent payloads create flaky tests in CI. Stubbing network calls ensures deterministic behavior.
await page.route("**/api/cart", (route) => {
  route.fulfill({ json: { items: [] } });
});
One common pitfall is route leakage across tests. Route handlers persist for the lifetime of the page or context, so if routes are registered in shared fixtures or global setup without proper teardown, they can unintentionally affect subsequent tests. This often manifests as CI-only failures where tests behave differently depending on execution order.
This eliminates external variability for UI flows, but excessive stubbing can mask real integration failures. Network stubbing should be limited to unstable third-party dependencies, while critical backend integrations should be validated separately.
Route handlers should be scoped as narrowly as possible. In most cases, routes belong inside individual tests or test-scoped fixtures so they are automatically cleaned up when the test completes. Avoid registering routes in global setup or shared fixtures unless every test in the suite explicitly depends on that behavior.
Diagnosing CI Failures Caused by Parallelism
Parallel execution is one of the most common sources of CI-only failures. Tests that pass reliably when run alone often fail under parallelism due to shared backend data, reused accounts, or non-isolated resources.
Typical symptoms include:
- Tests passing locally but failing only when multiple workers run
- Failures that disappear when workers are reduced to one
- Inconsistent data-related assertions
To diagnose parallelism-related issues:
- Run:
npx playwright test --workers=1
- Compare failures between parallel and serial runs
- Inspect whether multiple tests mutate the same backend records or reuse the same user accounts
Parallelism failures aren’t limited to backend data collisions.
A frequent source of parallelism-related failures is misuse of storageState across workers. When multiple tests or workers reuse the same authenticated storageState file, they effectively share session cookies and localStorage.
Under parallel execution, this can lead to session invalidation, unexpected logouts, or tests mutating the same server-side user state concurrently.
Parallel-safe test design typically requires isolating data per worker rather than per test suite. Common strategies include creating unique users per worker, namespacing records using the worker index, or provisioning test data dynamically at runtime.
Parallelism issues are rarely solved by retries or timeouts; they are almost always a data isolation problem. Parallelism also introduces architectural tradeoffs. Increasing worker count improves speed but amplifies data contention and fixture complexity. In some cases, selectively running high-risk flows serially or reducing worker count for specific test groups provides better overall stability than maximizing parallelism everywhere.
They can also stem from test-suite architecture itself. For example, worker-scoped fixtures (beforeAll, workerInfo), module-level variables, or shared helpers that unintentionally persist state across workers. These issues often surface only under parallel execution, making CI the first place they appear.
Final Thoughts
Debugging in CI can feel opaque, especially when local tests behave predictably. Much of the challenge comes from environmental discrepancies: slower infrastructure, fresh sessions, altered resource usage, or mismatched configurations.
With richer traces, targeted reruns, careful selector strategies, and systematic visibility enhancements, the debugging flow becomes clear. Maintaining a healthy CI environment, one that mirrors local conditions and avoids rigid timeouts, helps reduce false failures and align outcomes across all platforms.
Each improvement creates a stronger foundation for consistent test outcomes. With structured debugging, resilient selectors, and proactive CI maintenance, Playwright becomes a reliable tool for verifying application quality across environments. Stability grows with visibility, and visibility comes from the combined power of tracing, selective reruns, clear logs, and deliberate environment alignment.
Keep in mind that increasing global timeouts rarely solves CI flakiness. Failures almost always come from missing conditions or unstable selectors, not from the test runner needing "more time."
Join hundreds of teams using Currents.
Trademarks and logos mentioned in this text belong to their respective owners.


