Fixing Playwright Tests with AI: What Prompts Need to Actually Work
AI prompts can fix some Playwright test failures, but many need execution context to get the fix right. Here's where prompts work, where they break down, and how Currents MCP fills the gap.

You ask AI to fix a failing Playwright test. It sees "Timeout 30000ms exceeded" and suggests a different selector. The test still fails. The problem was never the selector. It was a network timeout in CI that doesn't reproduce locally.
This is where most prompt-based test fixing falls apart. The error message describes a symptom. The actual cause lives in execution history, environment differences, and patterns across runs. Without that context, AI fills in gaps with assumptions, and those assumptions are usually wrong.
This isn't specific to test debugging. Across every AI-assisted task, output quality depends more on the context the model receives than on how you word the prompt. Anthropic calls this context engineering: curating the right information for the model before it generates anything. For Playwright failures, that means execution history, environment data, and cross-run patterns, not just the latest stack trace.
Playwright Already Handles Most Timing Issues
Before blaming flakiness on missing AI context, check whether the test is using Playwright correctly. The framework's auto-waiting model performs actionability checks before every interaction: visibility, stability, enabled state, event receivability. Assertions like toHaveURL() and toBeVisible() auto-retry until the condition is met or the timeout expires.
This means most timing-related flakiness in well-written Playwright tests points to one of two things: the test is fighting the framework (adding manual waits, using non-retrying assertions, raw page.$() calls instead of locators), or the issue is genuinely external (slow API, CI environment differences, shared test state).
If you're seeing intermittent failures on basic interactions like clicks and fills, check whether you're using the locator API correctly before reaching for waits or retries. Many "flaky" Playwright tests are actually misusing the framework's primitives. Fix that first.
What Prompts Can Fix Without Help
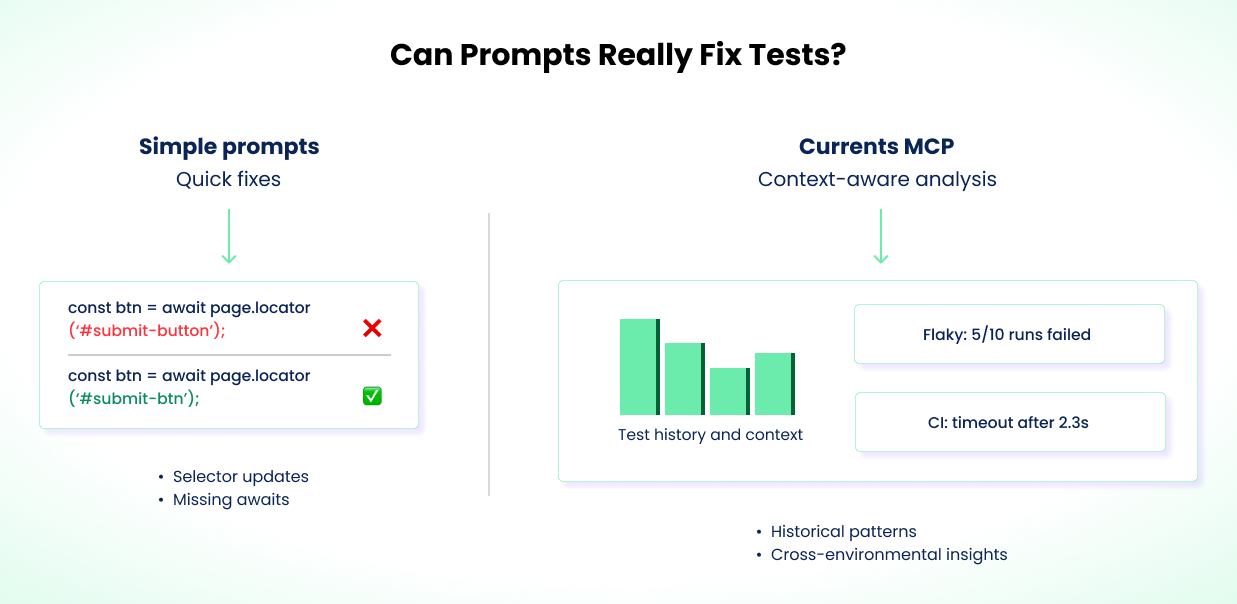
Some failures are simple enough that a prompt with the test code and stack trace is all you need.
A button ID changes from submit-button to submit-btn. The test times out. You tell AI the selector changed, it spots the outdated ID, you verify and apply. Done. This works when the failure is purely a selector mismatch with no timing or visibility issues underneath.
Missing await keywords are similar. The stack trace points to a specific line, AI identifies the missing await, and the fix is mechanical. Same for duplicated assertions or dead code from a refactor.
These are the straightforward cases. The failure is local, deterministic, and fully explained by the code and error output. Many real-world Playwright failures involve more than what the error message shows.
Even a simple selector fix can be wrong if the real problem is a hydration delay or CSS change that makes the element unavailable intermittently. If you're fixing the same test repeatedly, the issue probably isn't what the error message says it is.
Why Failures Are Harder Than They Look
Not all test failures have the same root cause, and the fix depends on the category:
- Timing / race conditions. The test asserts before the app is ready. Playwright's auto-waiting handles most UI cases, but external async operations (API calls, redirects, websocket events) can still create races.
- Network / infrastructure variability. The same test behaves differently across environments due to latency, DNS resolution, cold starts, or resource constraints on CI machines.
- Shared state / test isolation. Tests pass individually but fail when run together. Usually caused by shared databases, cookies, or global state bleeding between tests.
- Unstable selectors. Auto-generated IDs, dynamic class names, or DOM structure changes between builds.
- Test data issues. Tests depend on data that's modified by other tests, expires, or doesn't exist in the target environment.
A prompt with a stack trace can usually handle unstable selectors. It can't distinguish timing from infrastructure issues without execution history across multiple runs. The fix for a race condition (restructure the test) is fundamentally different from the fix for CI latency (adjust timeouts or environment config). Category matters, and the error message alone rarely tells you which category you're in.
Where Prompts Break Down
Consider a login test that fails in CI but passes locally every time. The error says "Timeout 5000ms exceeded" on an expect(page).toHaveURL('/dashboard') assertion. That 5000ms is Playwright's default expect timeout, not the test timeout. The distinction matters: an expect timeout means the assertion polled and gave up, while a test timeout means the entire test ran too long. Different causes, different fixes.
A prompt sees this and suggests bumping the timeout, adding a hard waitForTimeout(5000) before the assertion, or switching the selector. The timeout bump might work by accident. The waitForTimeout call is a hard wait anti-pattern that Playwright's own docs warn against. The selector change is completely wrong. None of these address why the redirect is slow in CI.
Playwright's built-in debugging tools help with single-run diagnosis. Trace viewer, failure screenshots, and video recordings show you exactly what happened during one execution. But they can't tell you whether this failure is a one-off or a pattern.
The Cross-Run Debugging Checklist
To fix failures like this correctly, you need answers that no single test run can provide. Here's what to look for:
Failure frequency. Check whether this test has failed before, and how often. A test that fails 3 out of 10 runs is a flaky timing issue. A test that fails every run has a deterministic bug. The fix is different for each. If you're only looking at the latest failure, you can't tell which one you're dealing with.
Environment correlation. Check whether failures cluster on specific CI runners, regions, or machine types. If the test passes on your local machine and on half the CI runners but fails on the rest, the problem is infrastructure, not code. You don't fix network latency by changing a selector.
Timing patterns. Look at how long the test runs before it fails. A test that always times out at exactly 5000ms is hitting a hard limit. A test that times out at varying durations (4.8s, 5.1s, 6.2s) is waiting on something external with variable latency. The first needs a timeout adjustment. The second needs a waitForResponse or a mock.
Run-level context. Check what else failed in the same run. If three unrelated tests all timed out, the CI machine was probably under load or the network was slow. If only the login test failed, the problem is specific to that flow.
Change history. Check when failures started. Did they begin after a specific commit, deploy, or infrastructure change? A failure that correlates with a CI region migration is an infrastructure issue. One that correlates with a code change is a regression. This distinction completely changes the fix.
You can gather this data manually by comparing CI runs, grepping through build logs, and cross-referencing deploy timelines. It's tedious but possible. The problem is doing it consistently, especially when you're investigating multiple failures across a large suite.
Without this cross-run data, AI defaults to treating every failure as a code bug. It suggests code changes for infrastructure problems. It adds hard waits for network issues. It changes selectors for timing bugs. Sometimes the test passes on the next run, not because the fix was right, but because the transient condition didn't recur.
Fixing the Login Test
Back to the login test. Here's how you'd investigate it properly using the checklist above.
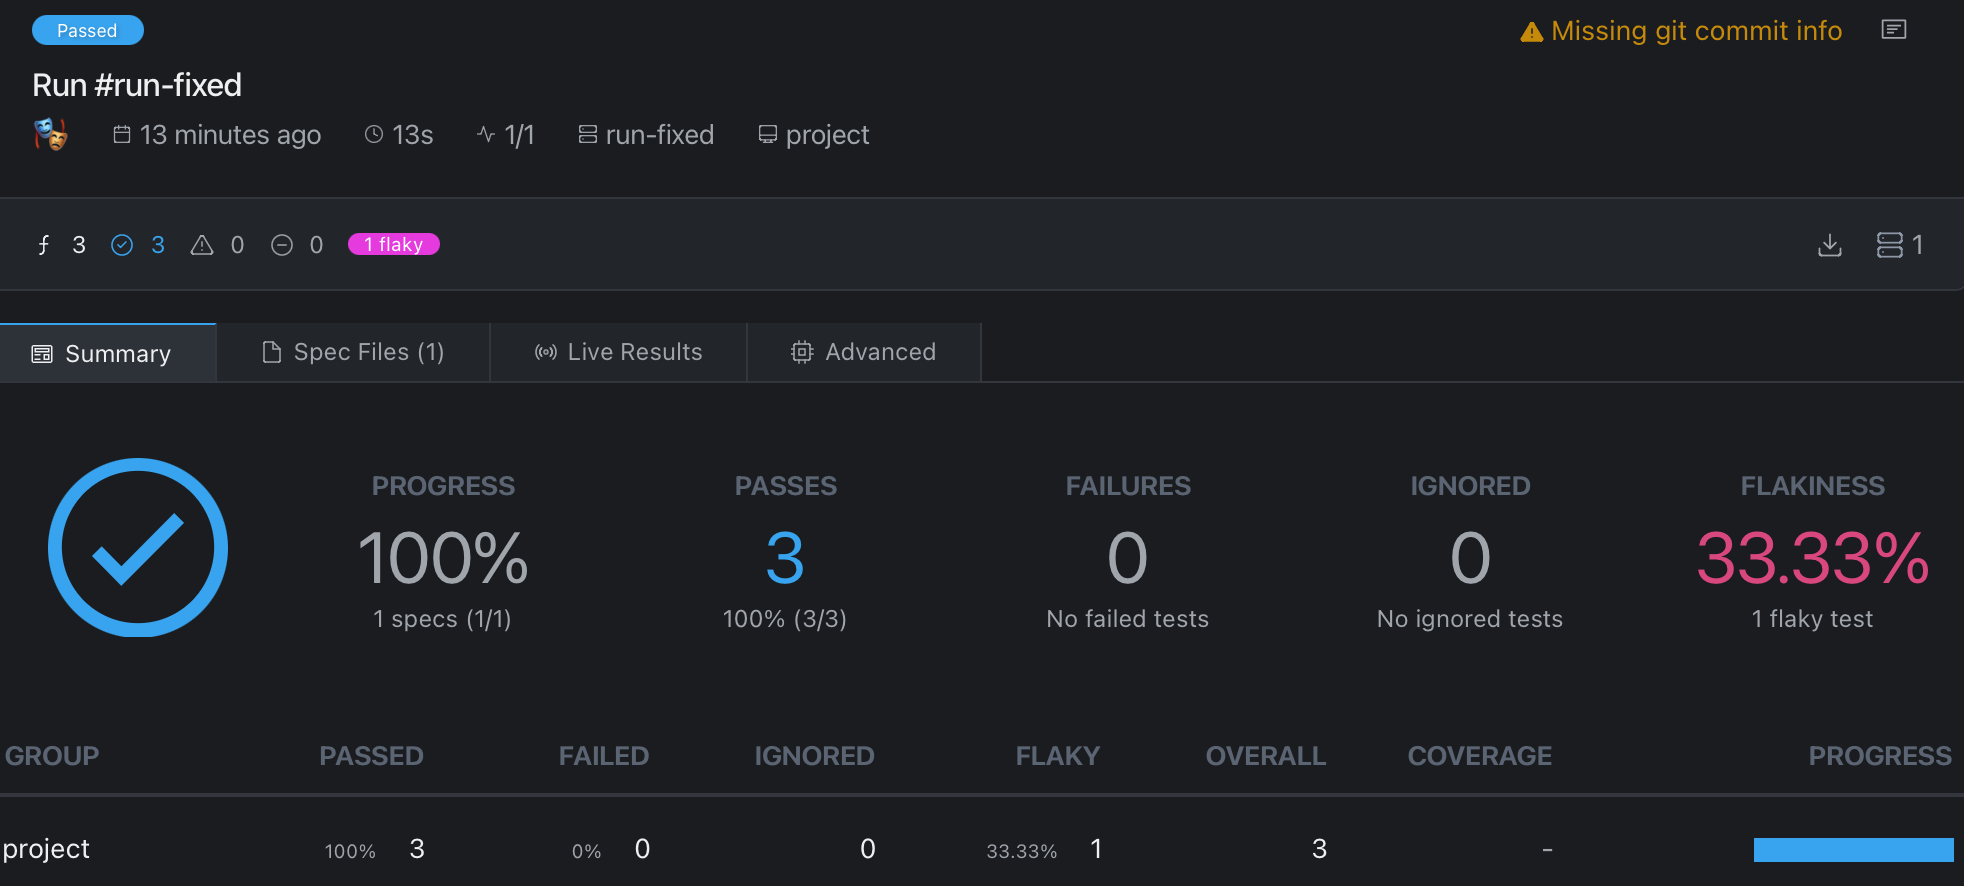
You check the last 10 CI runs. The login test failed 3 times, each time timing out at the 5-second default expect timeout while waiting for the redirect. Failures started the same week CI machines moved to a new region.
You compare timing data. The redirect averages 2.8s locally but 5.1s in CI, enough to blow past the default expect timeout on slower runs. The test has retries: 1 in config and passes on retry about half the time. That confirms the issue is timing, not logic.
The failure isn't a code bug. The CI environment's network latency makes the default expect timeout too tight. Instead of patching one assertion, the right fix is structural: adjust the expect timeout globally in playwright.config.ts for CI, and wait for the actual API response before asserting the URL.
// playwright.config.ts
export default defineConfig({
  expect: {
    timeout: process.env.CI ? 10_000 : 5_000,
  },
});
// Before: assertion races against a slow redirect
await expect(page).toHaveURL("/dashboard");

// After: wait for the auth API to respond, then assert the URL
await page.waitForResponse(
  (resp) => resp.url().includes("/api/auth") && resp.status() === 200,
);
await expect(page).toHaveURL("/dashboard");
The config change keeps you from sprinkling per-assertion timeouts across the suite. waitForResponse is used here because the bottleneck is a specific API call, and Playwright's auto-waiting can't detect that an auth endpoint is still in flight. It ties the test to the actual bottleneck (the API round-trip) instead of guessing a timeout value. If the auth endpoint degrades further, the test fails with a clear signal instead of silently passing at 9.9 seconds.
A tradeoff: waitForResponse couples your test to the network layer. If the API path changes, the test breaks for reasons unrelated to auth behavior. An alternative is waiting for a UI signal, like a dashboard element becoming visible, that confirms the redirect completed. Both are valid. waitForResponse is more precise when you know the bottleneck is a specific API call. UI-based waits are more resilient to backend changes. Pick based on what's more stable in your codebase.
Without execution history, AI would likely have suggested a hard waitForTimeout(), a selector change, or a per-assertion timeout bump. The debugging checklist led to a fix that addresses the actual cause at the right layer.
How Currents MCP Automates the Investigation
The investigation above took manual work: checking multiple CI runs, comparing timing, correlating with infrastructure changes. Currents MCP automates the data-gathering step by connecting AI agents directly to your test execution history in Currents.
Instead of you digging through CI logs, the agent queries the data itself. You prompt:
Tests are failing in CI. Get all the details from my last run and fix the authentication failures.
The agent calls currents-get-run-details and currents-get-test-results for the failing test. It pulls the same data points you'd gather manually (failure frequency, timing patterns, environment correlation, retry behavior) but finds them in seconds instead of minutes.
Here's a subset of what the agent can query:
| Tool | What it gives you |
|---|---|
currents-get-run-details | Full details of a specific run: status, timing, environment, failures |
currents-get-test-results | Historical results for a specific test across runs |
currents-get-tests-performance | Aggregated metrics: duration, retries, flakiness rates |
currents-get-errors-explorer | Error patterns grouped and filtered across a date range |
The complete set of tools is in the GitHub repo.
The key difference from manual debugging: when you paste a stack trace into a prompt, you're choosing what context to include. You might leave out the fact that the test passed 8 out of 10 times, or that failures only started after an infrastructure change. Currents MCP lets the agent discover that context on its own, following the same debugging checklist a human would, but without the manual log-diving.
Currents MCP doesn't auto-fix tests. It doesn't change your code or merge PRs. It gives AI better information to suggest better fixes. You review and apply them. Not every failure needs it. If the stack trace tells the whole story, skip it. It's most useful for the cross-run, cross-environment failures where single-run tools like trace viewer hit their limits.
Evaluate Fixes, Not Just Results
Not every fix that makes a test pass is the right fix. A timeout bump might mask a performance regression. A waitForResponse might couple your test to an implementation detail. Retries might hide a real bug that surfaces under load. Before applying any AI-suggested fix, ask whether it addresses the root cause or just the symptom.
Some failures shouldn't be "fixed" at all. They should be redesigned: mock the flaky API, use storage state instead of a login flow, isolate test data. If the same test keeps failing for different reasons, the problem is the test design, not the latest error. We cover this in depth in Debugging Playwright Timeouts, How To Build Reliable Playwright Tests, and What Is a Flaky Test and How to Fix It.
How to Use This Safely
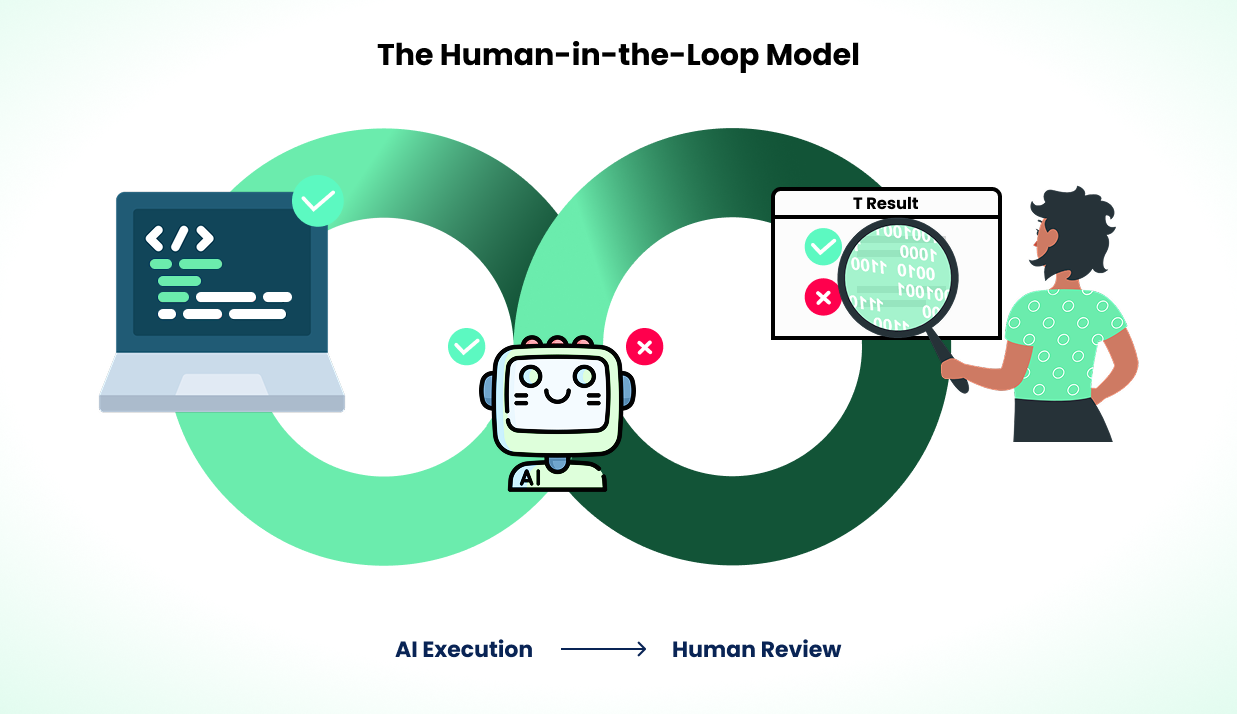
Better context improves AI suggestions, but AI still gets things wrong. Every suggestion needs human review.
Review every fix, even when the reasoning looks right. AI can construct convincing explanations for incorrect fixes. Check that the change addresses the root cause, not just a symptom. A test that passes after a change might pass for the wrong reason. Verify against multiple runs, not just a single local execution.
Prefer structural fixes over patches. If AI suggests changing a selector from #submit to #submit-button, ask why the selector changed. If IDs are unstable, the better fix is switching to data-testid attributes. If a timeout increase fixes a flaky test, investigate why the timing varies. A global config change or a waitForResponse on the actual bottleneck beats a per-assertion timeout. Check whether the issue is isolated or part of a broader pattern across your suite.
Use Playwright's retries as a signal, not a fix. Setting retries: 2 in config is standard practice for CI. But a test that needs retries to pass is flaky, and flaky tests kill confidence in the suite. Retries buy you time to investigate, not permission to stop. If a test's retry rate is climbing, it needs investigation, not more retries.
Track reliability, not just pass rates. A test suite with zero failures can still hide problems. Tests might pass because they're too lenient or because a fix masked a real bug. Track flakiness trends, duration changes, and retry rates over time alongside defect detection rates and time spent debugging. These tell you whether your suite is actually getting better. Currents tracks these metrics across runs automatically, but even a spreadsheet of CI results over time is better than nothing.
Include context in PRs. When a prompt-generated fix goes into a pull request, include the failure pattern, the reasoning behind the change, and how you verified it. This makes fixes traceable and reviewable by the rest of your team.
The workflow improves over time. You'll learn which failure types AI handles well (selector updates, timeout adjustments) and which need deeper investigation (auth flows, shared state bugs). Start cautious and build confidence from results.
Join hundreds of teams using Currents.
Trademarks and logos mentioned in this text belong to their respective owners.


