Cypress Dashboard vs Currents - Ultimate Comparison Guide
A detailed comparison guide between Cypress Dashboard and the most popular alternatives - Currents and Sorry Cypress. Pricing, analytics, orchestration, load balancing, compatibility, parallelization, integrations and unit economics are compared between the solutions.

Edit Aug 30, 2023: This article was updated with information about Currents support of Playwright
Cypress is one of the most popular end-to-end front-end test automation frameworks, widely used by many companies worldwide. In addition to classic end-to-end browser-based tests, Cypress is being used for UI components testing, API tests, smoke testing, and synthetics checks.
Eventually, when you start running a large number of tests in a CI pipeline, you start facing a few problems:
- sequential test execution takes a long time
- test failures in CI environment are hard to reproduce and troubleshoot
- flaky tests waste your team's time and waste CI resources
- performance and health of the test suite deteriorate
Software and QA teams use a complimentary service like Cypress Dashboard, Currents or Sorry Cypress to resolve those issues, and additionally enjoy extra "perks", like integrations with Slack, GitHub (and more), REST API (Currents only). Using those tools can greatly improve developer experience: save valuable time, resources, and frustration, while keeping your test suite under control.
For example, parallelization is a natural solution for sequential test execution - it reduces overall build duration within a Continuous Integration environment.
Having video recordings, screenshots, call stack, and exact source code locations are very helpful for troubleshooting failed tests. Detecting and reporting flaky tests helps teams to improve the reliability and performance of their test suite. In addition, the dashboards collect and aggregate various stats and metrics related to the performance of your tests. Overall, dashboards provide a comprehensive testing experience and improve the efficiency of Cypress test suite.
There are currently two main alternatives to the Cypress Dashboard: Currents and Sorry Cypress. In this article, we'll dive deep into comparing the features that those solutions offer.
Table of contents
- Overview
- Features Comparison
- Debugging and Troubleshooting
- Flaky Tests
- Environment and Build Information
- Integrations
- Analytics and reporting
- Pricing: Cypress Dashboard vs. Sorry Cypress vs. Currents
- CI Providers, Compatibility, and Support
- Conclusion
Overview
Cypress Dashboard
Cypress Dashboard is the original service provided by Cypress.io - the company behind the open-source MIT-licensed Cypress runner. Used by many larger companies like PayPal, DHL, and Disney, it is the most popular, mainstream, but also the most expensive solution. The following are the main features it provides.
- Debugging and analytics
- Test grouping and optimization
- Parallelization and load balancing
- Video recording, stack traces, and screenshots of failed tests
- Flake detection
- Integration with Slack, GitHub, GitLab, and Jira
- Works with any CI provider
Sorry Cypress
Sorry Cypress is the most known and popular alternative to Cypress Dashboard. With 170K+ weekly downloads and 5M+ downloads on Dockerhub, it's being used in many industries as a self-hosted, free, open-source, MIT-licensed solution that provides many of the essential features with theoretically unlimited tests recording and parallelization.
Sorry Cypress supports deployment on many cloud platforms, such as K8S, AWS, Azure, and Google Cloud. Apart from parallelization, and storing screenshots and videos, it provides integrations with GitLab, Github, BitBucket + HTTP Webhooks, progress tracking, and test grouping capabilities. However, as you will see from the features comparison below, it lacks features that may be important - like smart orchestration, permissions management, analytics and some integrations.
Currents
Currents is a paid version of Sorry Cypress - it is a cloud-based, managed solution that is similar to the original Cypress Dashboard and has almost identical functionality while offering subscription plans that are 45-60% less expensive.
Here's a high-level overview of Currents functionality, described in more detail in the next chapters:
- parallelization and smart orchestration by using historical data for reducing the tests execution time even more
- debugging tools: screenshots and videos, stack traces and source code highlighting
- history of test and spec files executions
- integrations and automation: REST API, HTTP Webhooks, GitHub / GitLab / Slack and more
- insights and reports like top failing tests, top flaky tests, runs status and failure rate, runs duration distribution, test suite size, spec files failure rate, flakiness analysis and stability
- premium support, SSO, access controls, roles, flexible plans
- Currents supports the Playwright framework, which can be used simultaneously with Cypress
Features Comparison
Parallelization and Orchestration
Basic Parallelization / Load Balancing
All three tools provide basic parallelization to reduce test execution time by automatically splitting your tests across multiple CI machines. Parallelization allows using the full capacity of your CI fleet - each machine executes just a small subset of tests.
The dashboards provide instructions for each machine and automatically balance the tests without the need to manually configure the splits logic. The parallelization works on any CI provider that is capable of spinning a few workers/containers for the same build.
- Currents: ✅
- Sorry Cypress: ✅
- Cypress Dashboard: ✅
Optimal Parallelization and Smart Orchestration
Both Currents and Cypress Dashboard implement optimal parallelization by using historical data to optimally sort the tests and produce a more predictable execution order.
By using the historical duration metric for each file, the files with the longest duration are getting prioritized. It helps reduce build duration even more. Sorry Cypress is the only solution that doesn't support optimal parallelization.
- Currents: ✅
- Sorry Cypress: ❌
- Cypress Dashboard: ✅
Running Failed Specs First
By running test with the highest fail rate first, you can be aware of the failing test as early as possible - it allows you to reduce CI resources usage, get faster feedback and deploy fixes sooner.
Cypress Dashboard is provides the smart orchestration feature "Running failed specs first", but it is only available to Business Plan customers.
- Currents: ✅
- Sorry Cypress: ❌
- Cypress Dashboard: ✅ 💼
Fail-Fast
When a single test fails in your test suite, sometimes there is no point in executing the rest of the tests. Both Currents and Cypress Dashboard can cancel the whole run when a test fails. It automatically cancels the build and marks it as failed. The primary advantage of using fail-fast strategy is reducing CI costs, it makes CI resources available to test quick fixes.
- Currents: ✅
- Sorry Cypress: ❌
- Cypress Dashboard: ✅
Test Grouping
All three solutions provide a “test grouping” feature using which you can group tests by specific contexts like the browser, the operating system, the environment, etc., within the same run. Grouping tests have many benefits. For example, grouping by browser helps you to implement a CI strategy for Cross Browser Testing. Also, if you have a monorepo that contains many projects, you can group tests by projects in that monorepo.
- Currents: ✅
- Sorry Cypress: ✅
- Cypress Dashboard: ✅
Runs Cancellation
Due to the distributed nature of running tests in parallel on multiple machines and the limitations of Cypress architecture, canceling a run via a CI provider can cause a timeout. That's why it's better to cancel/stop a run via a dashboard - they will send the cancellation request to CI machines associated with the run and will gracefully mark the run as canceled, without causing a timeout.
Cypress Dashboard only allows canceling the runs via dashboard UI, while Currents allows cancellation via dashboard UI and also via an API call, which (in combination with HTTP webhooks) allows customers to create powerful automation.
- Currents: REST API ✅, UI ✅
- Sorry Cypress: ❌
- Cypress Dashboard: REST API ❌, UI ✅
Parallelization and Orchestration Comparison Table
| Feature | Cypress Dashboard | Sorry Cypress | Currents |
|---|---|---|---|
| Basic Parallelization | ✅ | ✅ | ✅ |
| Optimal Parallelization | ✅ | ❌ | ✅ |
| Running Failed Specs First | ✅ 💼 | ❌ | ✅ |
| Test Grouping | ✅ | ✅ | ✅ |
| Fail-Fast Strategy | ✅ 💼 | ❌ | ✅ |
| Cancellation Methods | UI only | None | UI, API |
💼 - Business Plan only, starting $300/month
Debugging and Troubleshooting
Record screenshots and record videos of failed tests
All the tools allow you to capture auto-generated failed test screenshots and videos to determine exactly where the failure happened. You can configure cypress runner to record arbitrary screenshots and videos of passed tests as well.
You can then replay the videos/screenshots for troubleshooting your test performance and execution during a CI run. The artifacts are stored on the respective services' cloud storage and can be downloaded when needed.
- Currents: ✅
- Sorry Cypress: ✅
- Cypress Dashboard: ✅
CI Logs
Currents and Cypress Dashboard also save and display the CI logs for the associated tests. Those logs capture the terminal output produced by cypress runner for later examining the execution trace of tests on a CI machine.
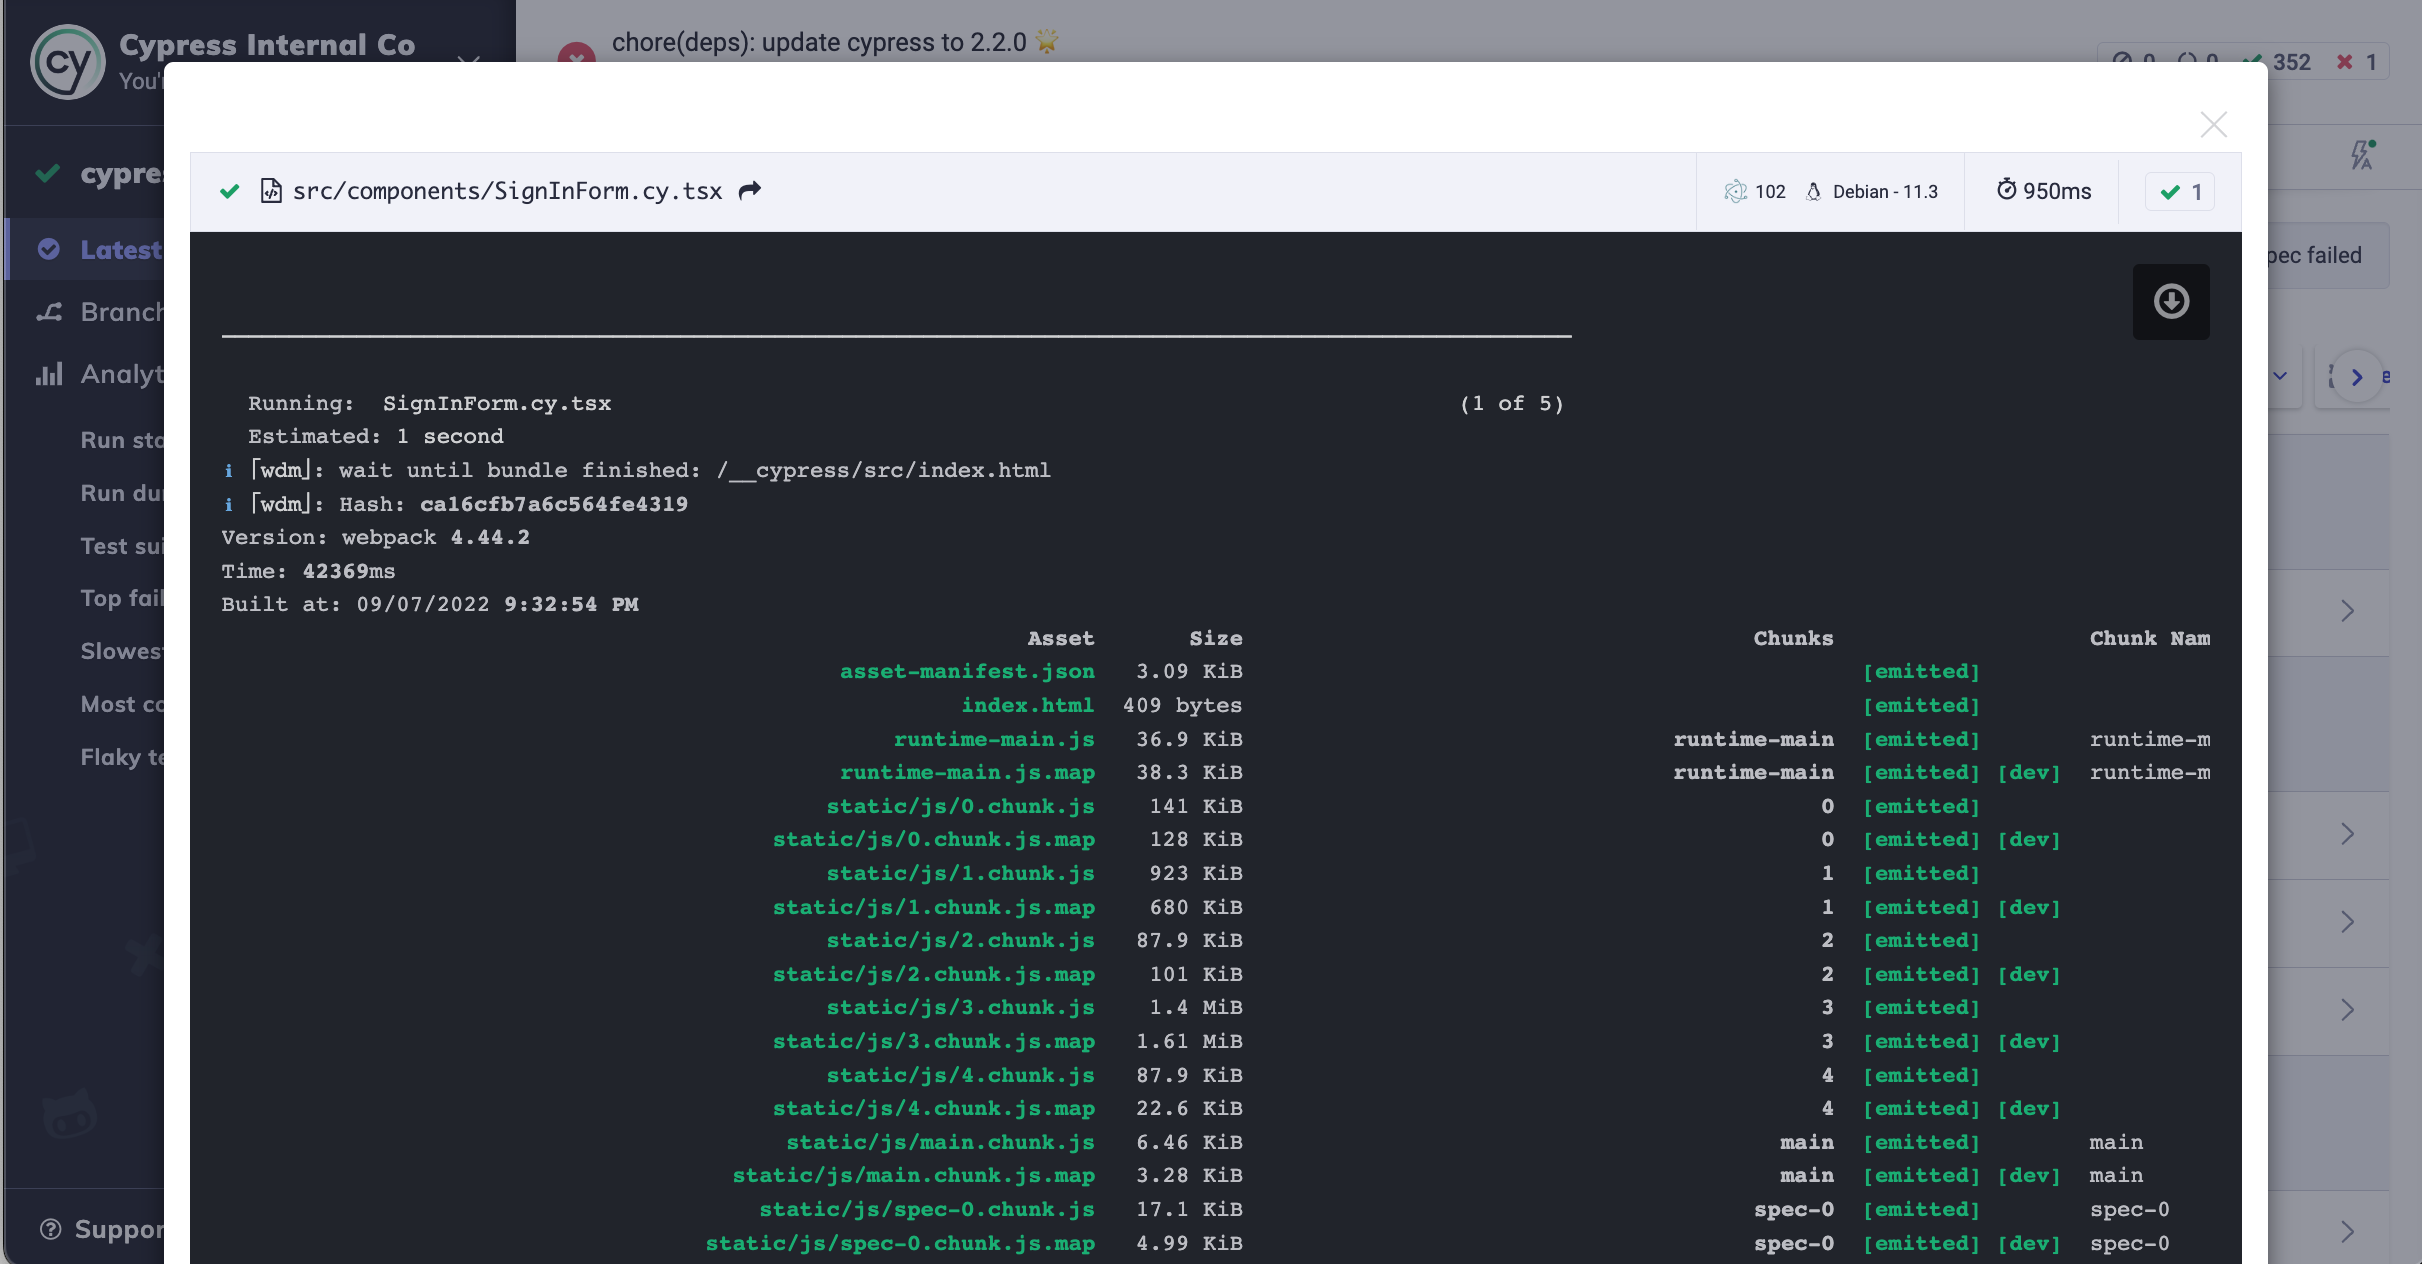
Together with cypress plugins like cypress-terminal-report one can reproduce the commands used by cypress runner during its execution and pinpoint the exact reason for failure.
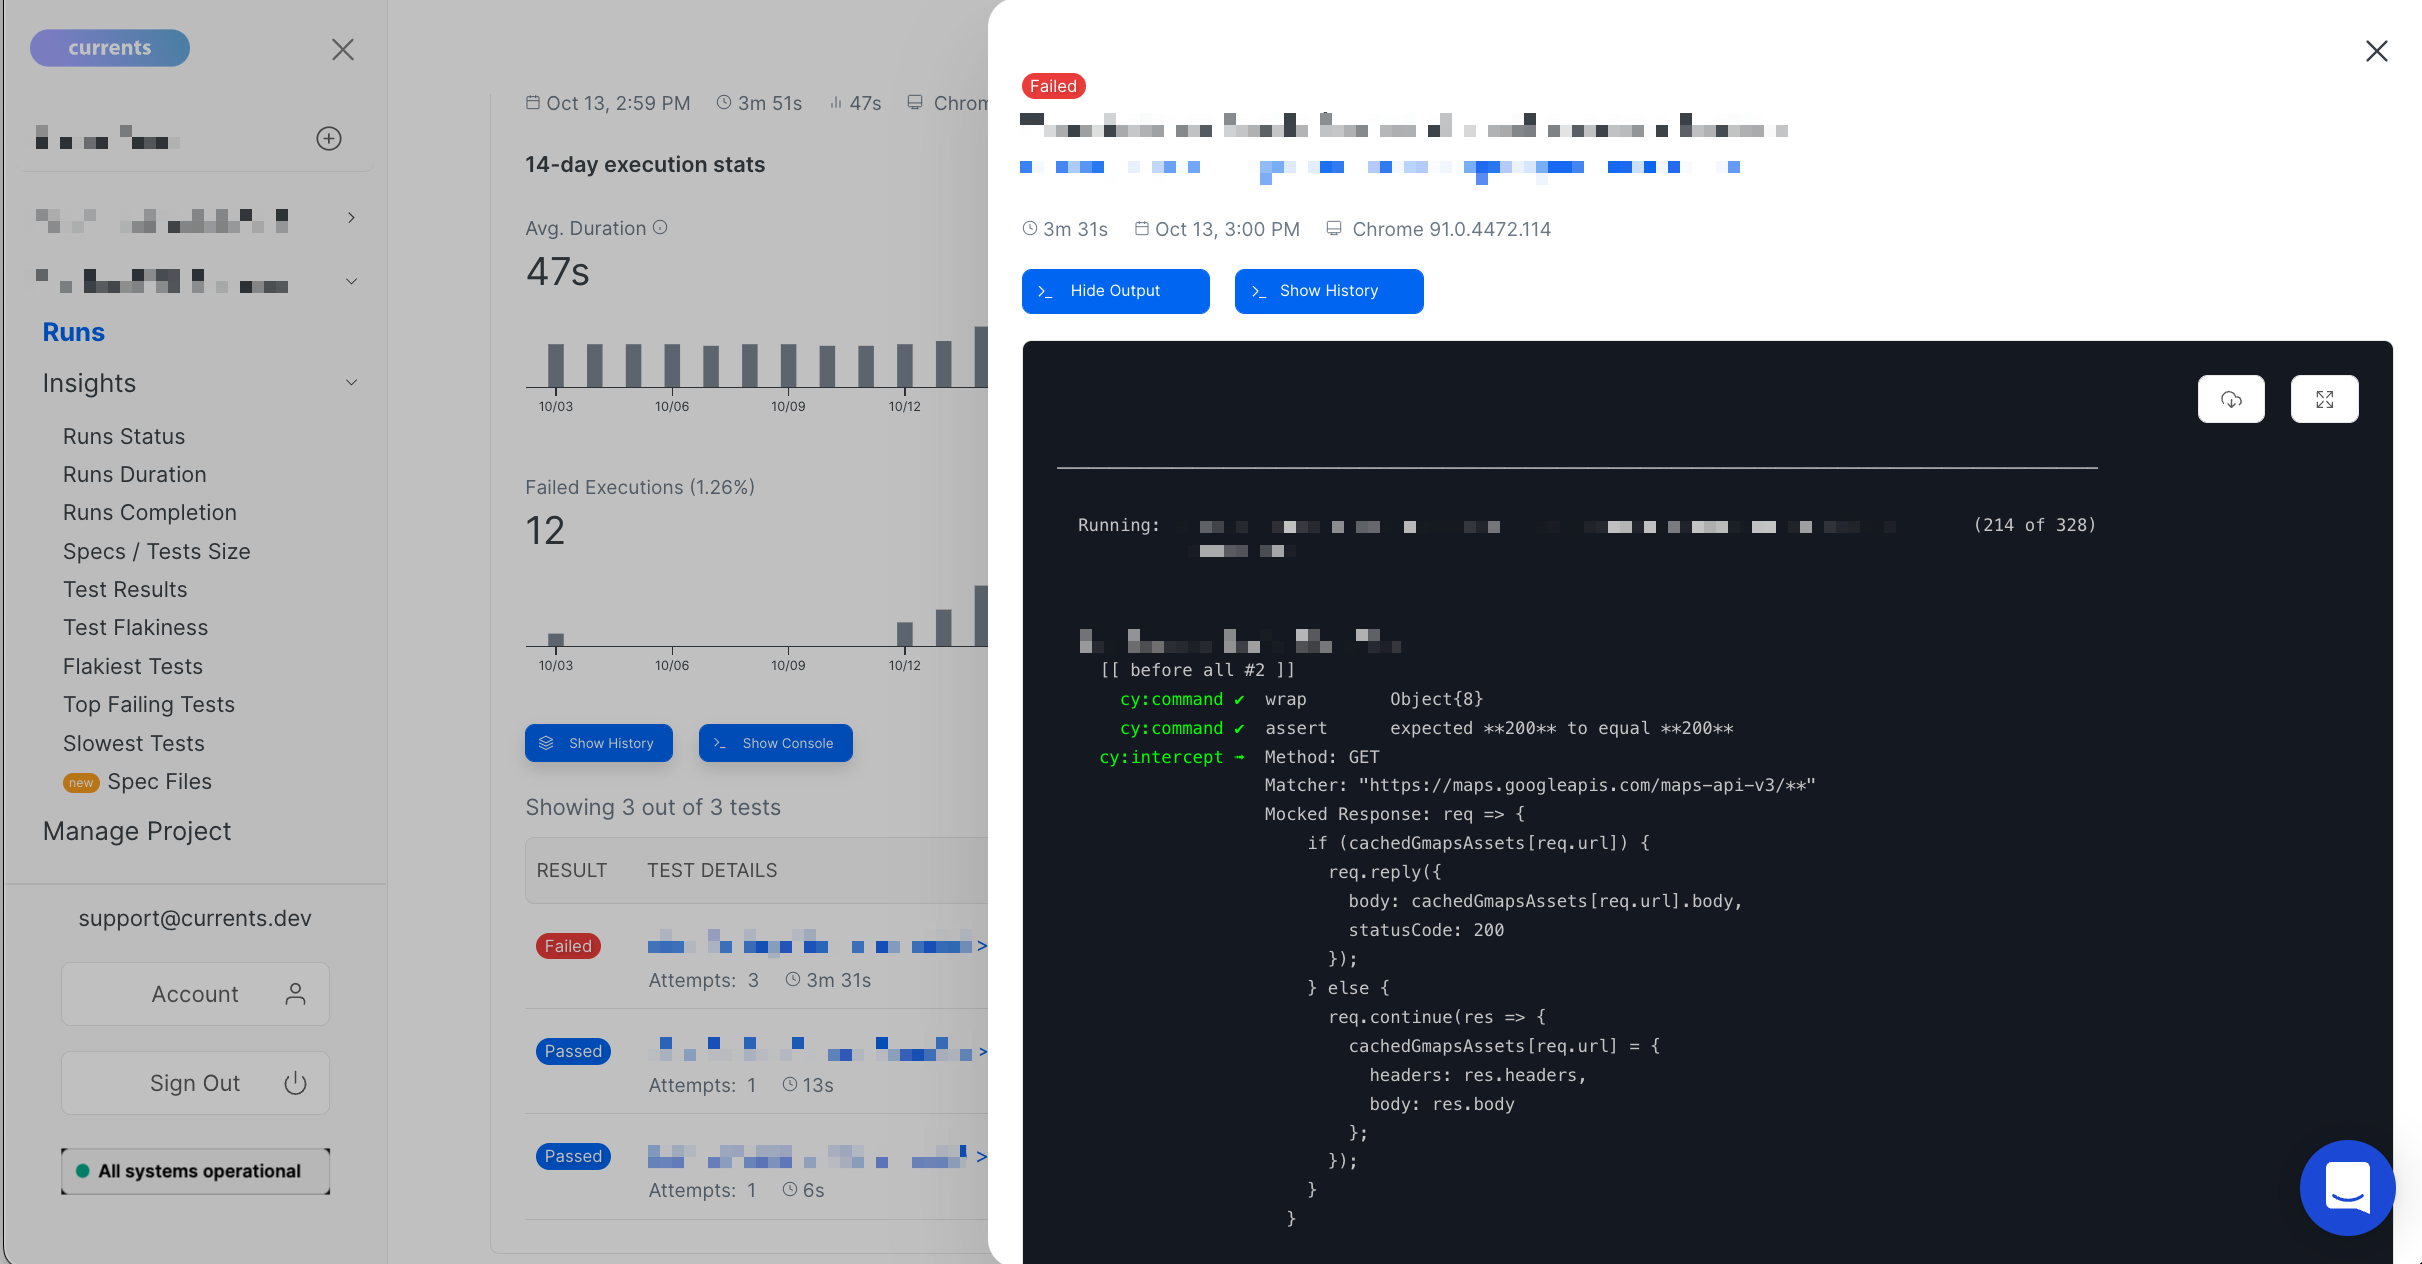
- Currents: ✅
- Sorry Cypress: ❌
- Cypress Dashboard: ✅
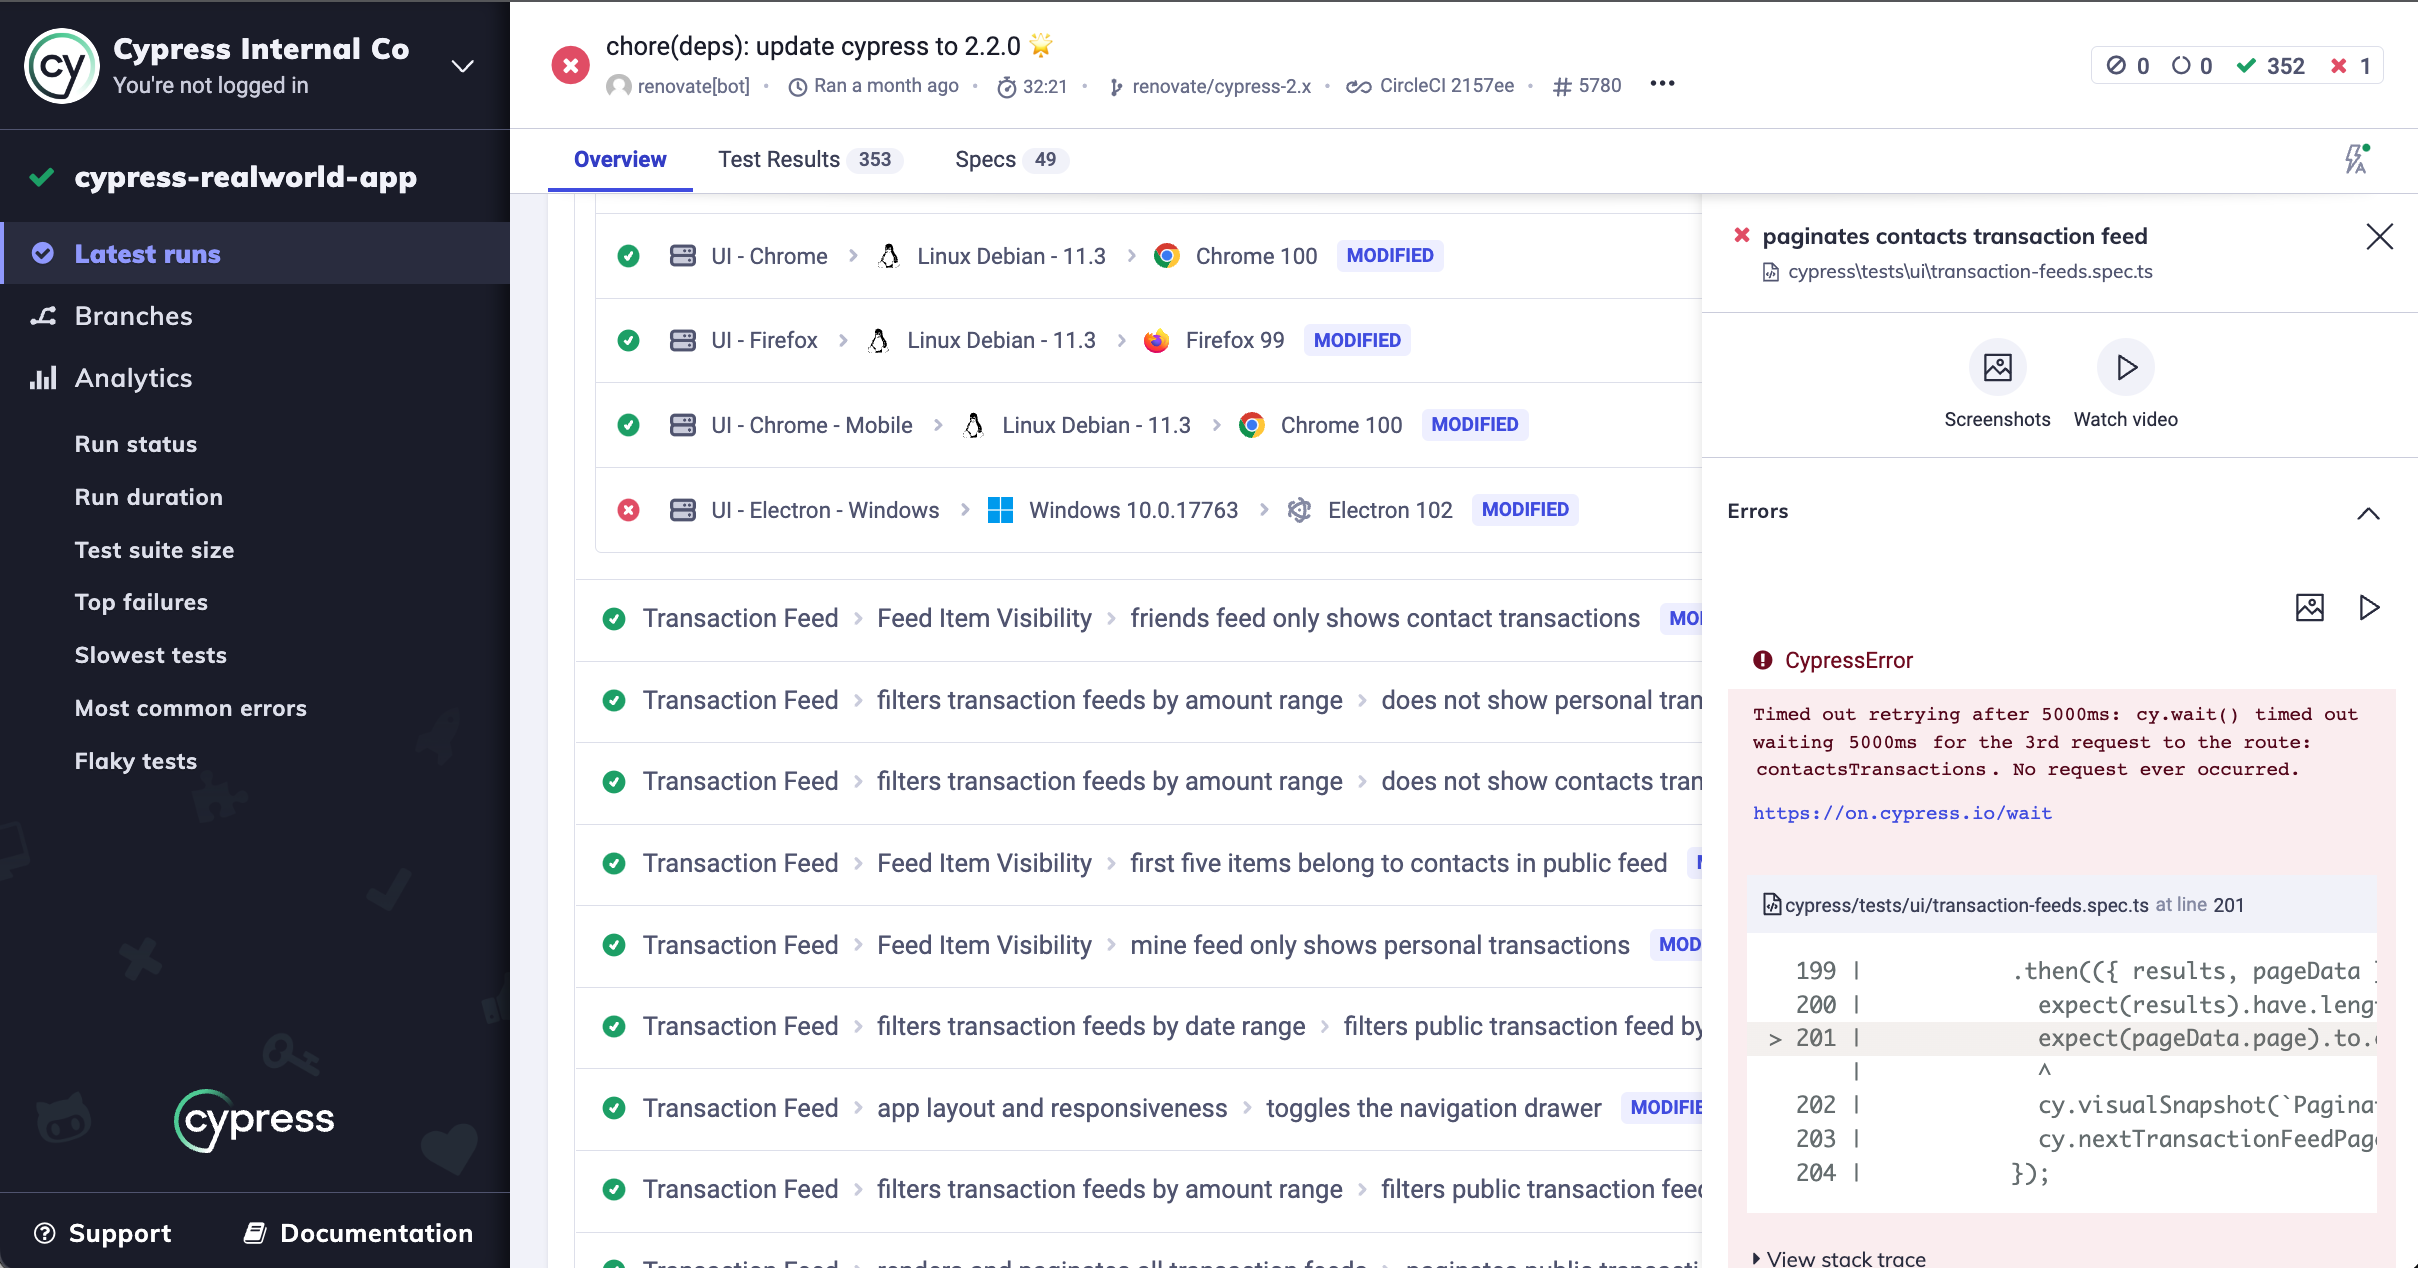
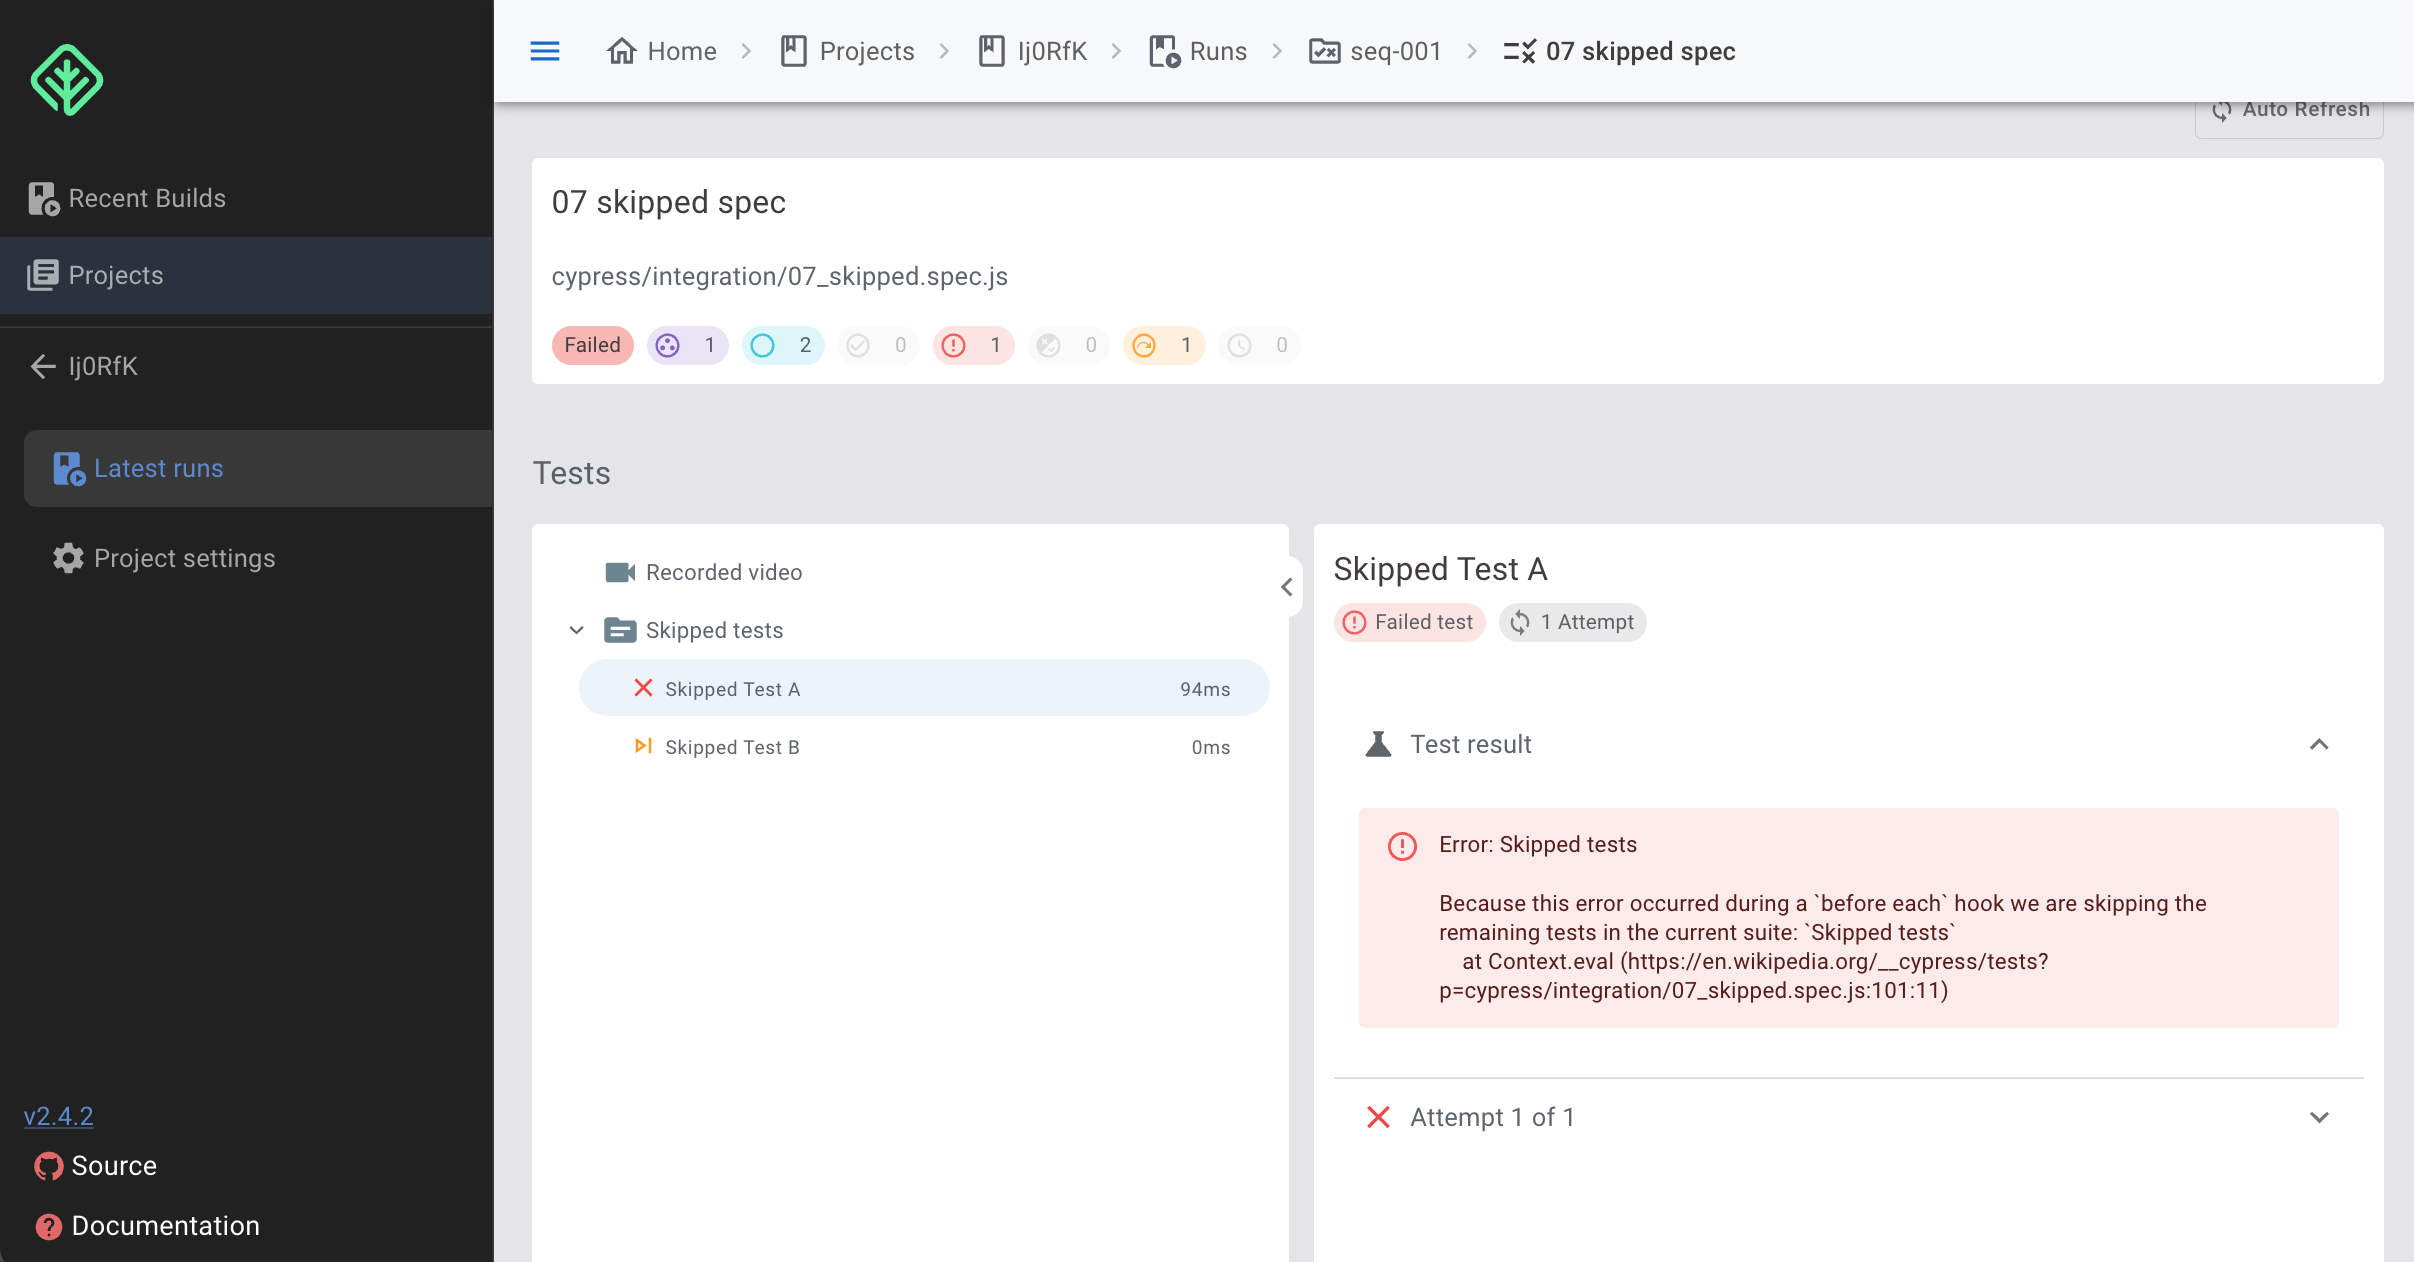
Errors Stack Trace
For every test failure, the tools display the title of the failed test, the error stack trace, and the error message. Using the error stack trace, you can track down where the problem originates.
- Currents: ✅
- Sorry Cypress: ✅
- Cypress Dashboard: ✅
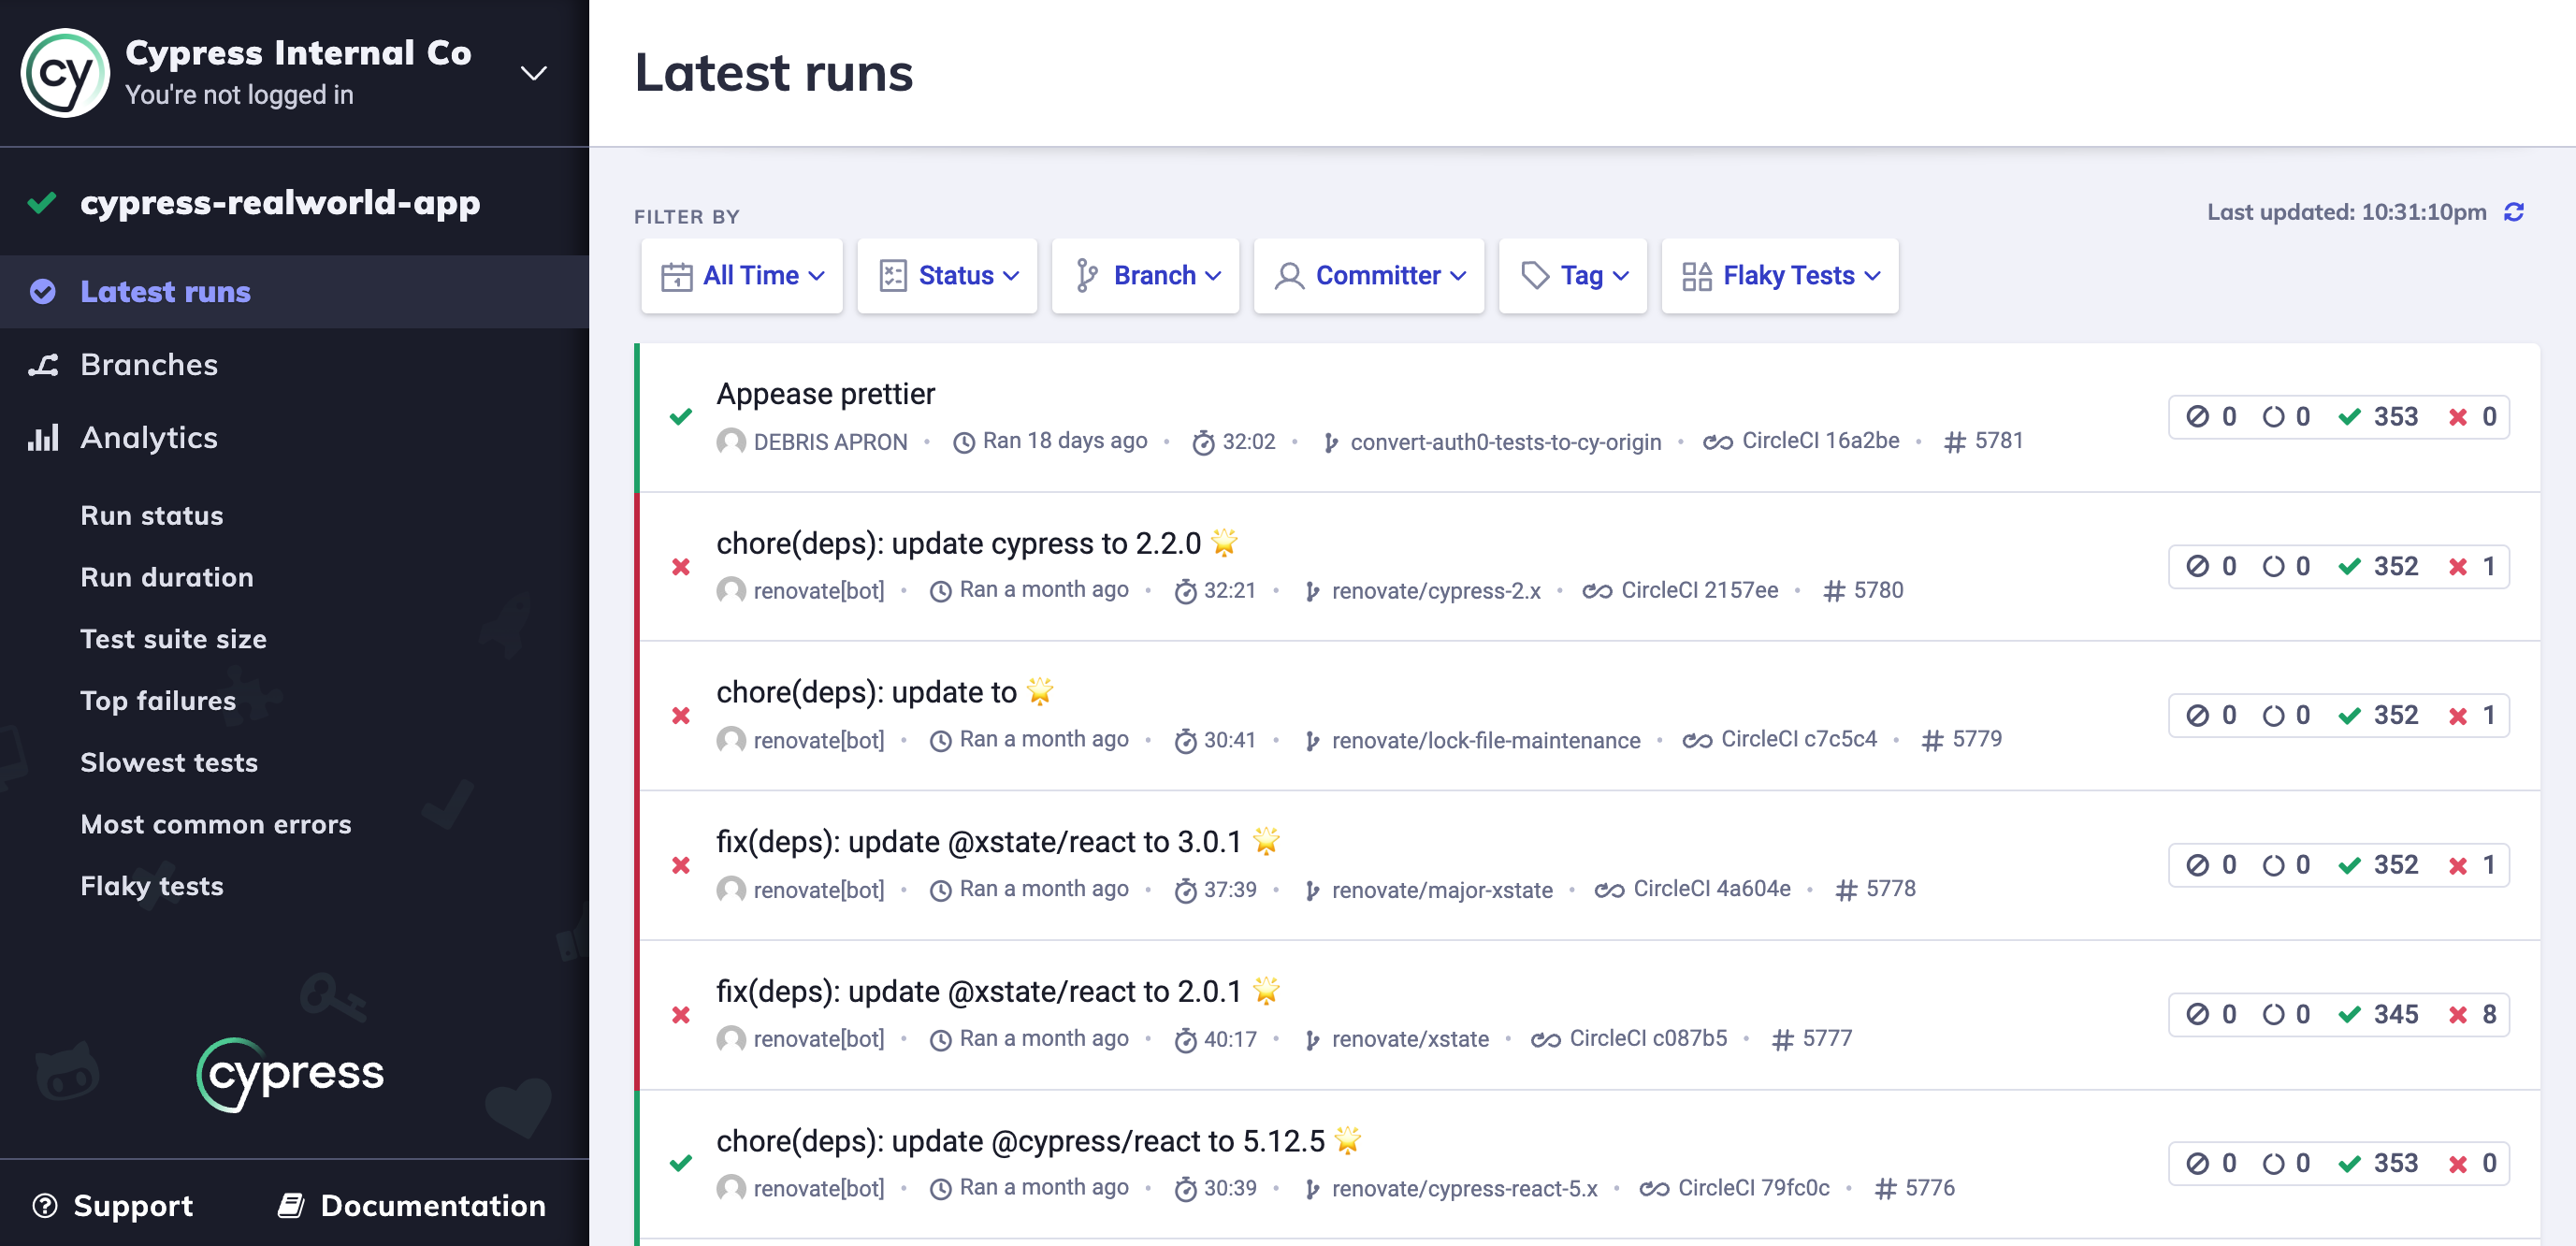
Test Runs History
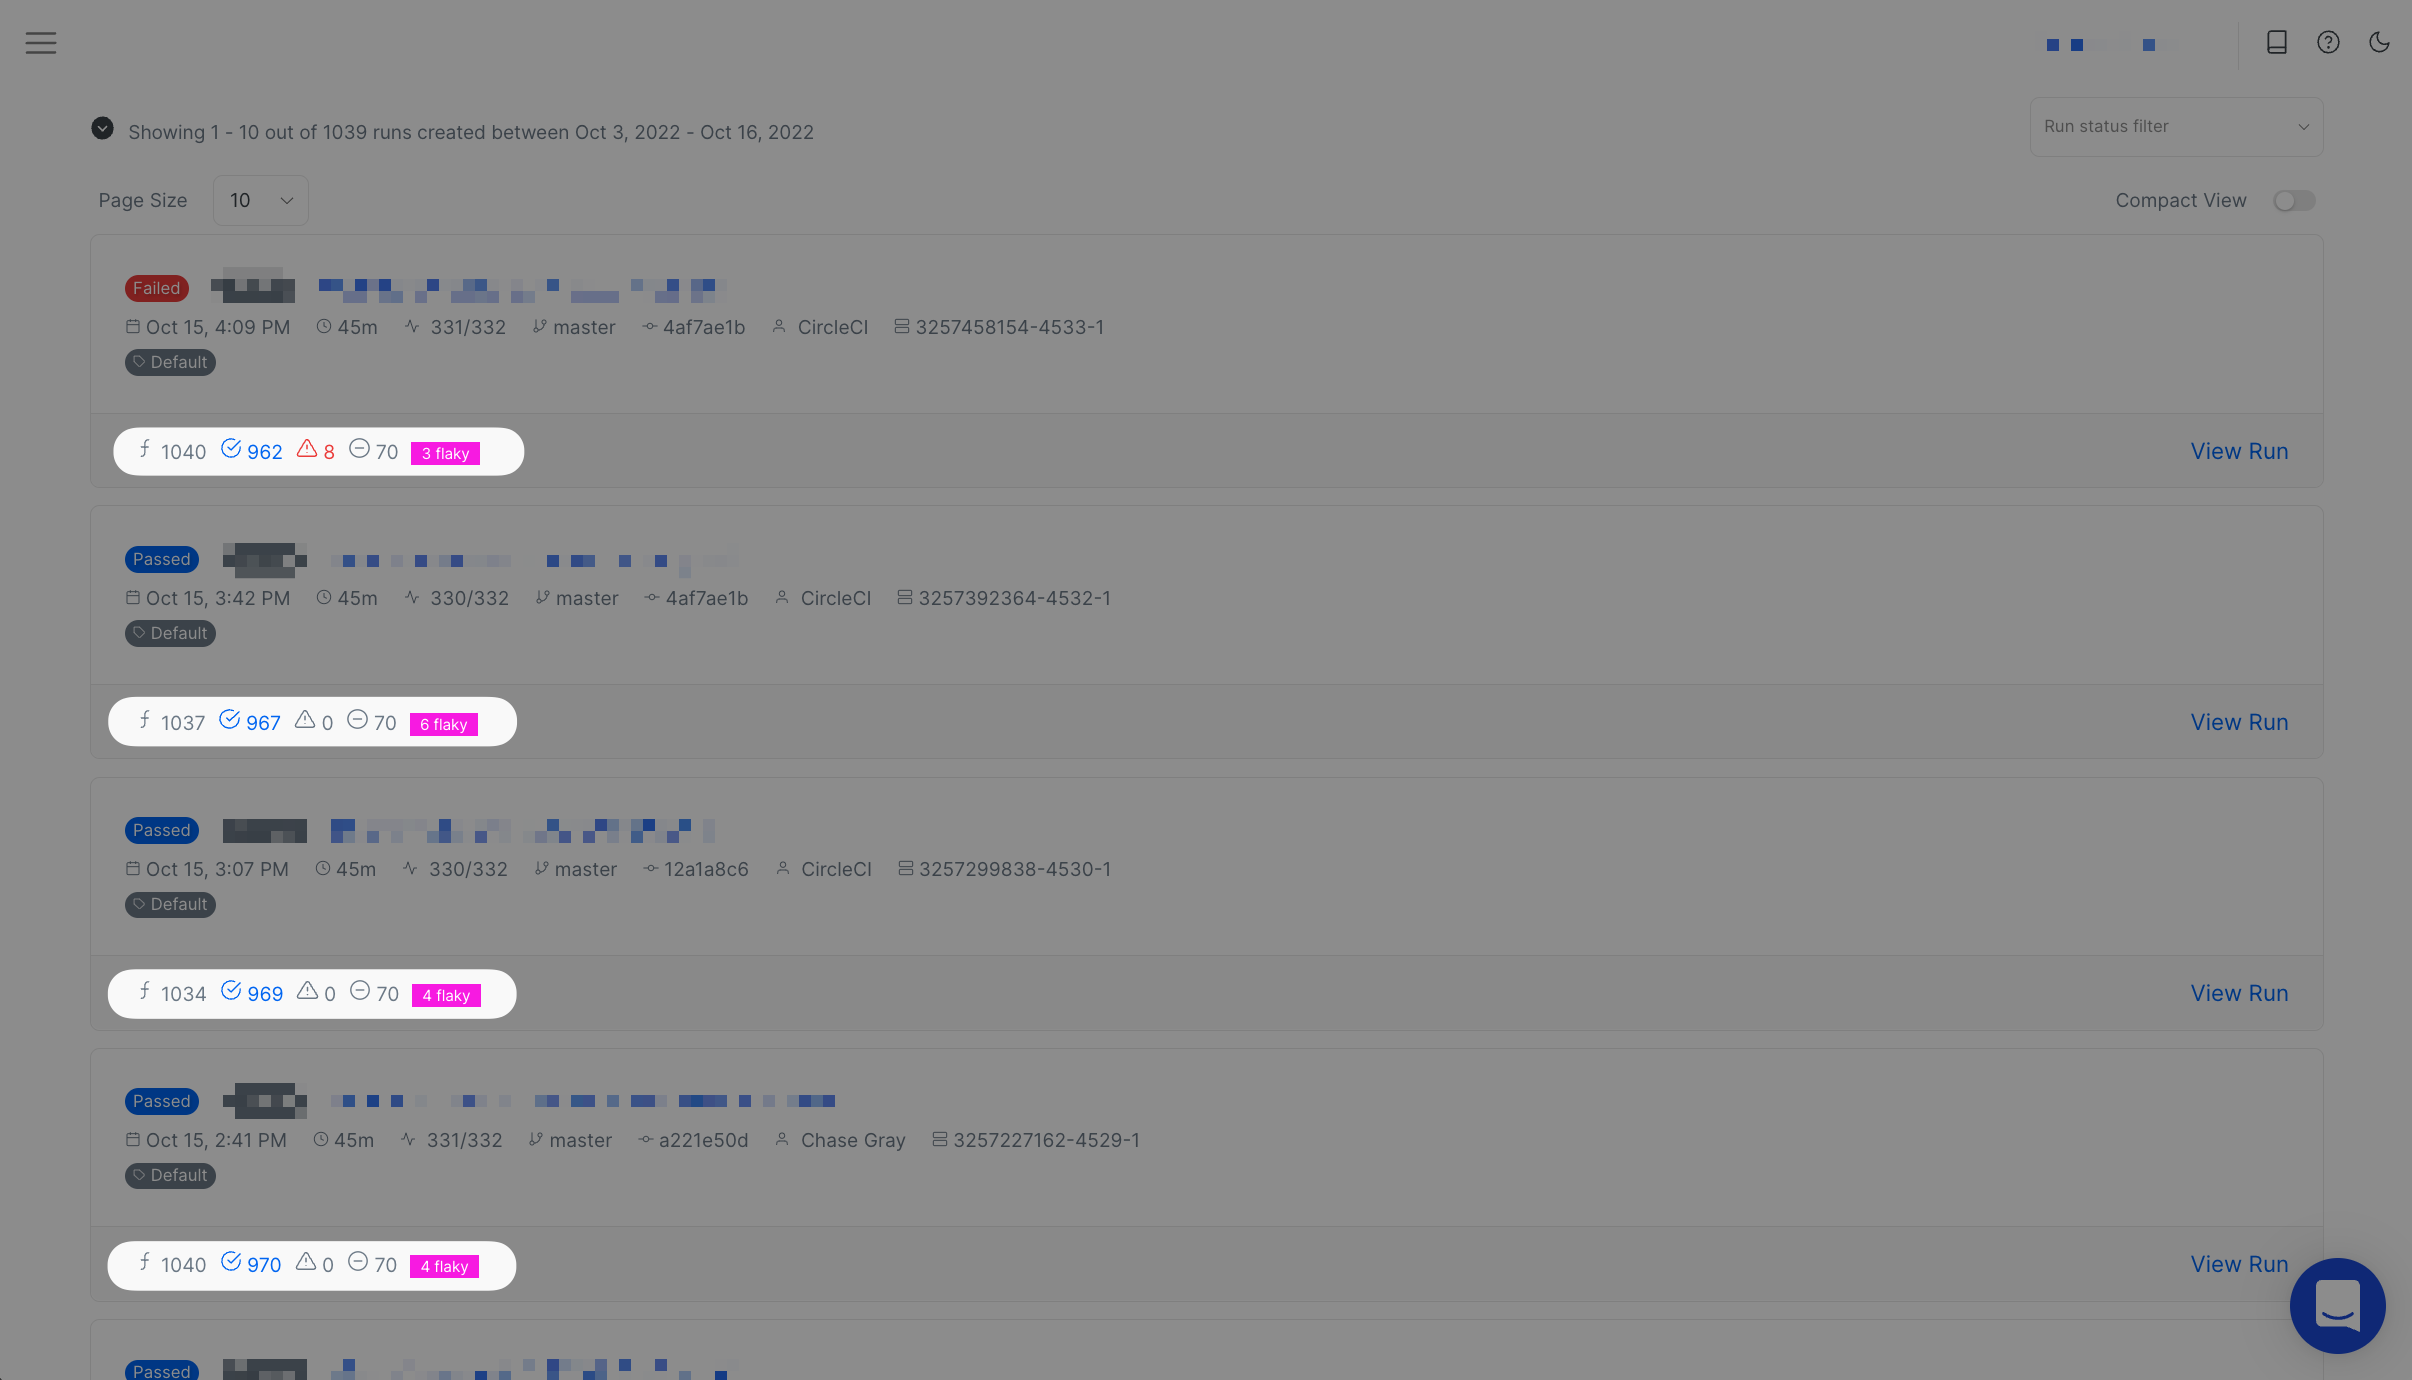
Both Cypress Dashboard and Currents provide a test runs history feature where you can see the previous executions of a test over its lifespan. Cypress Dashboard provides a basic explorer of test runs history that only shows the execution results (pass/failure) and the associated git information.
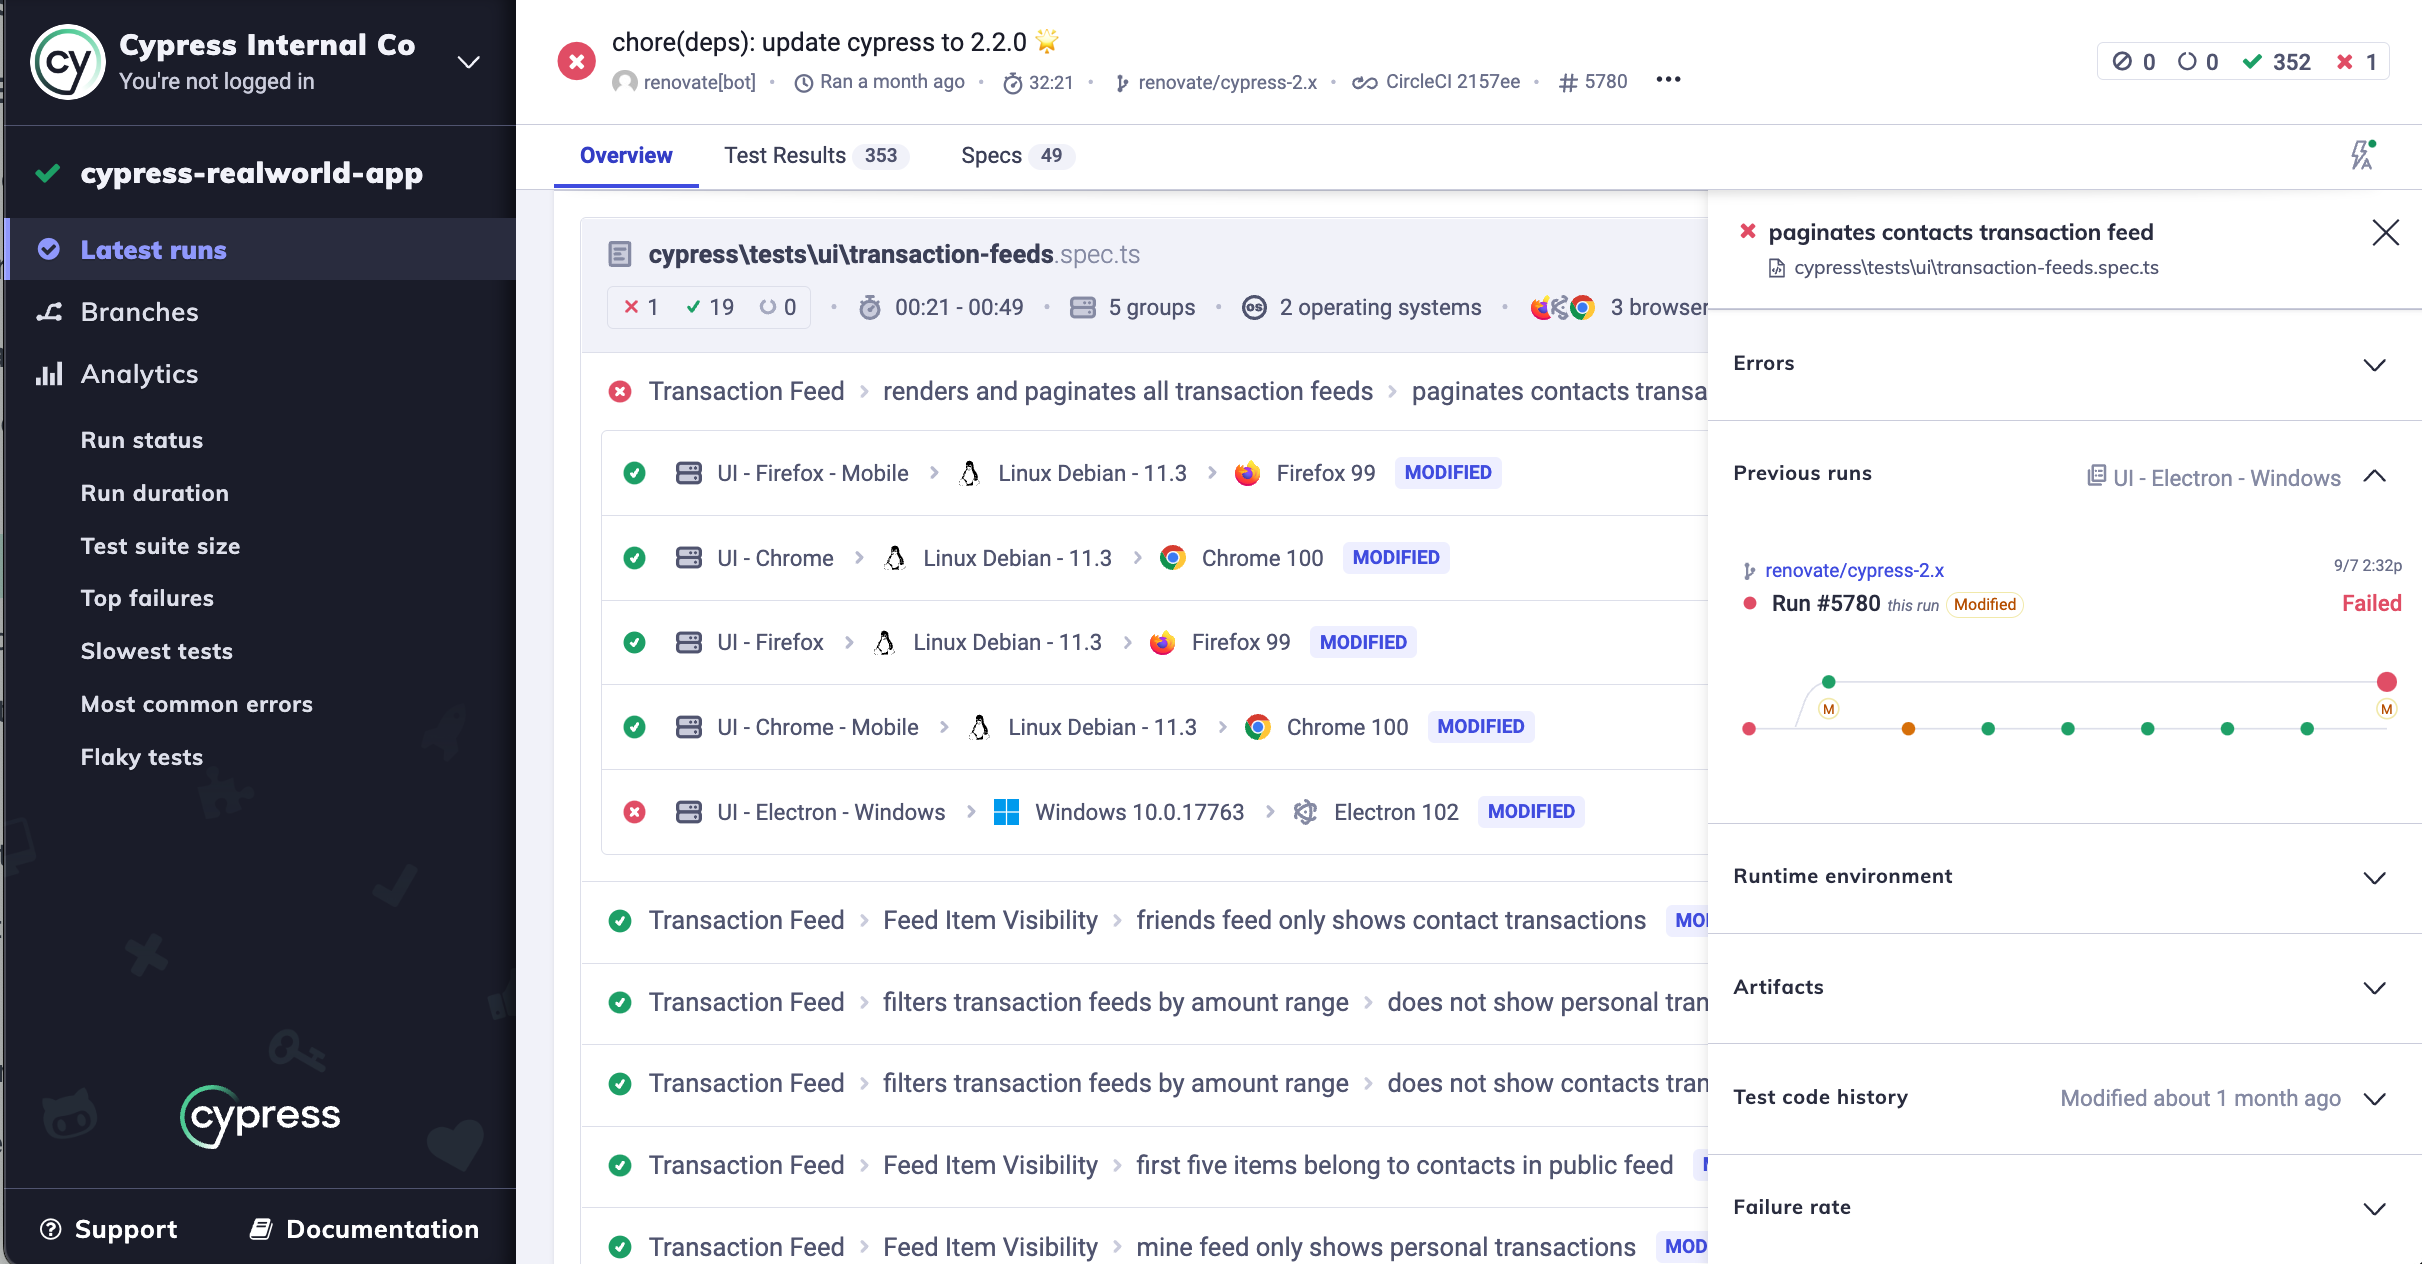
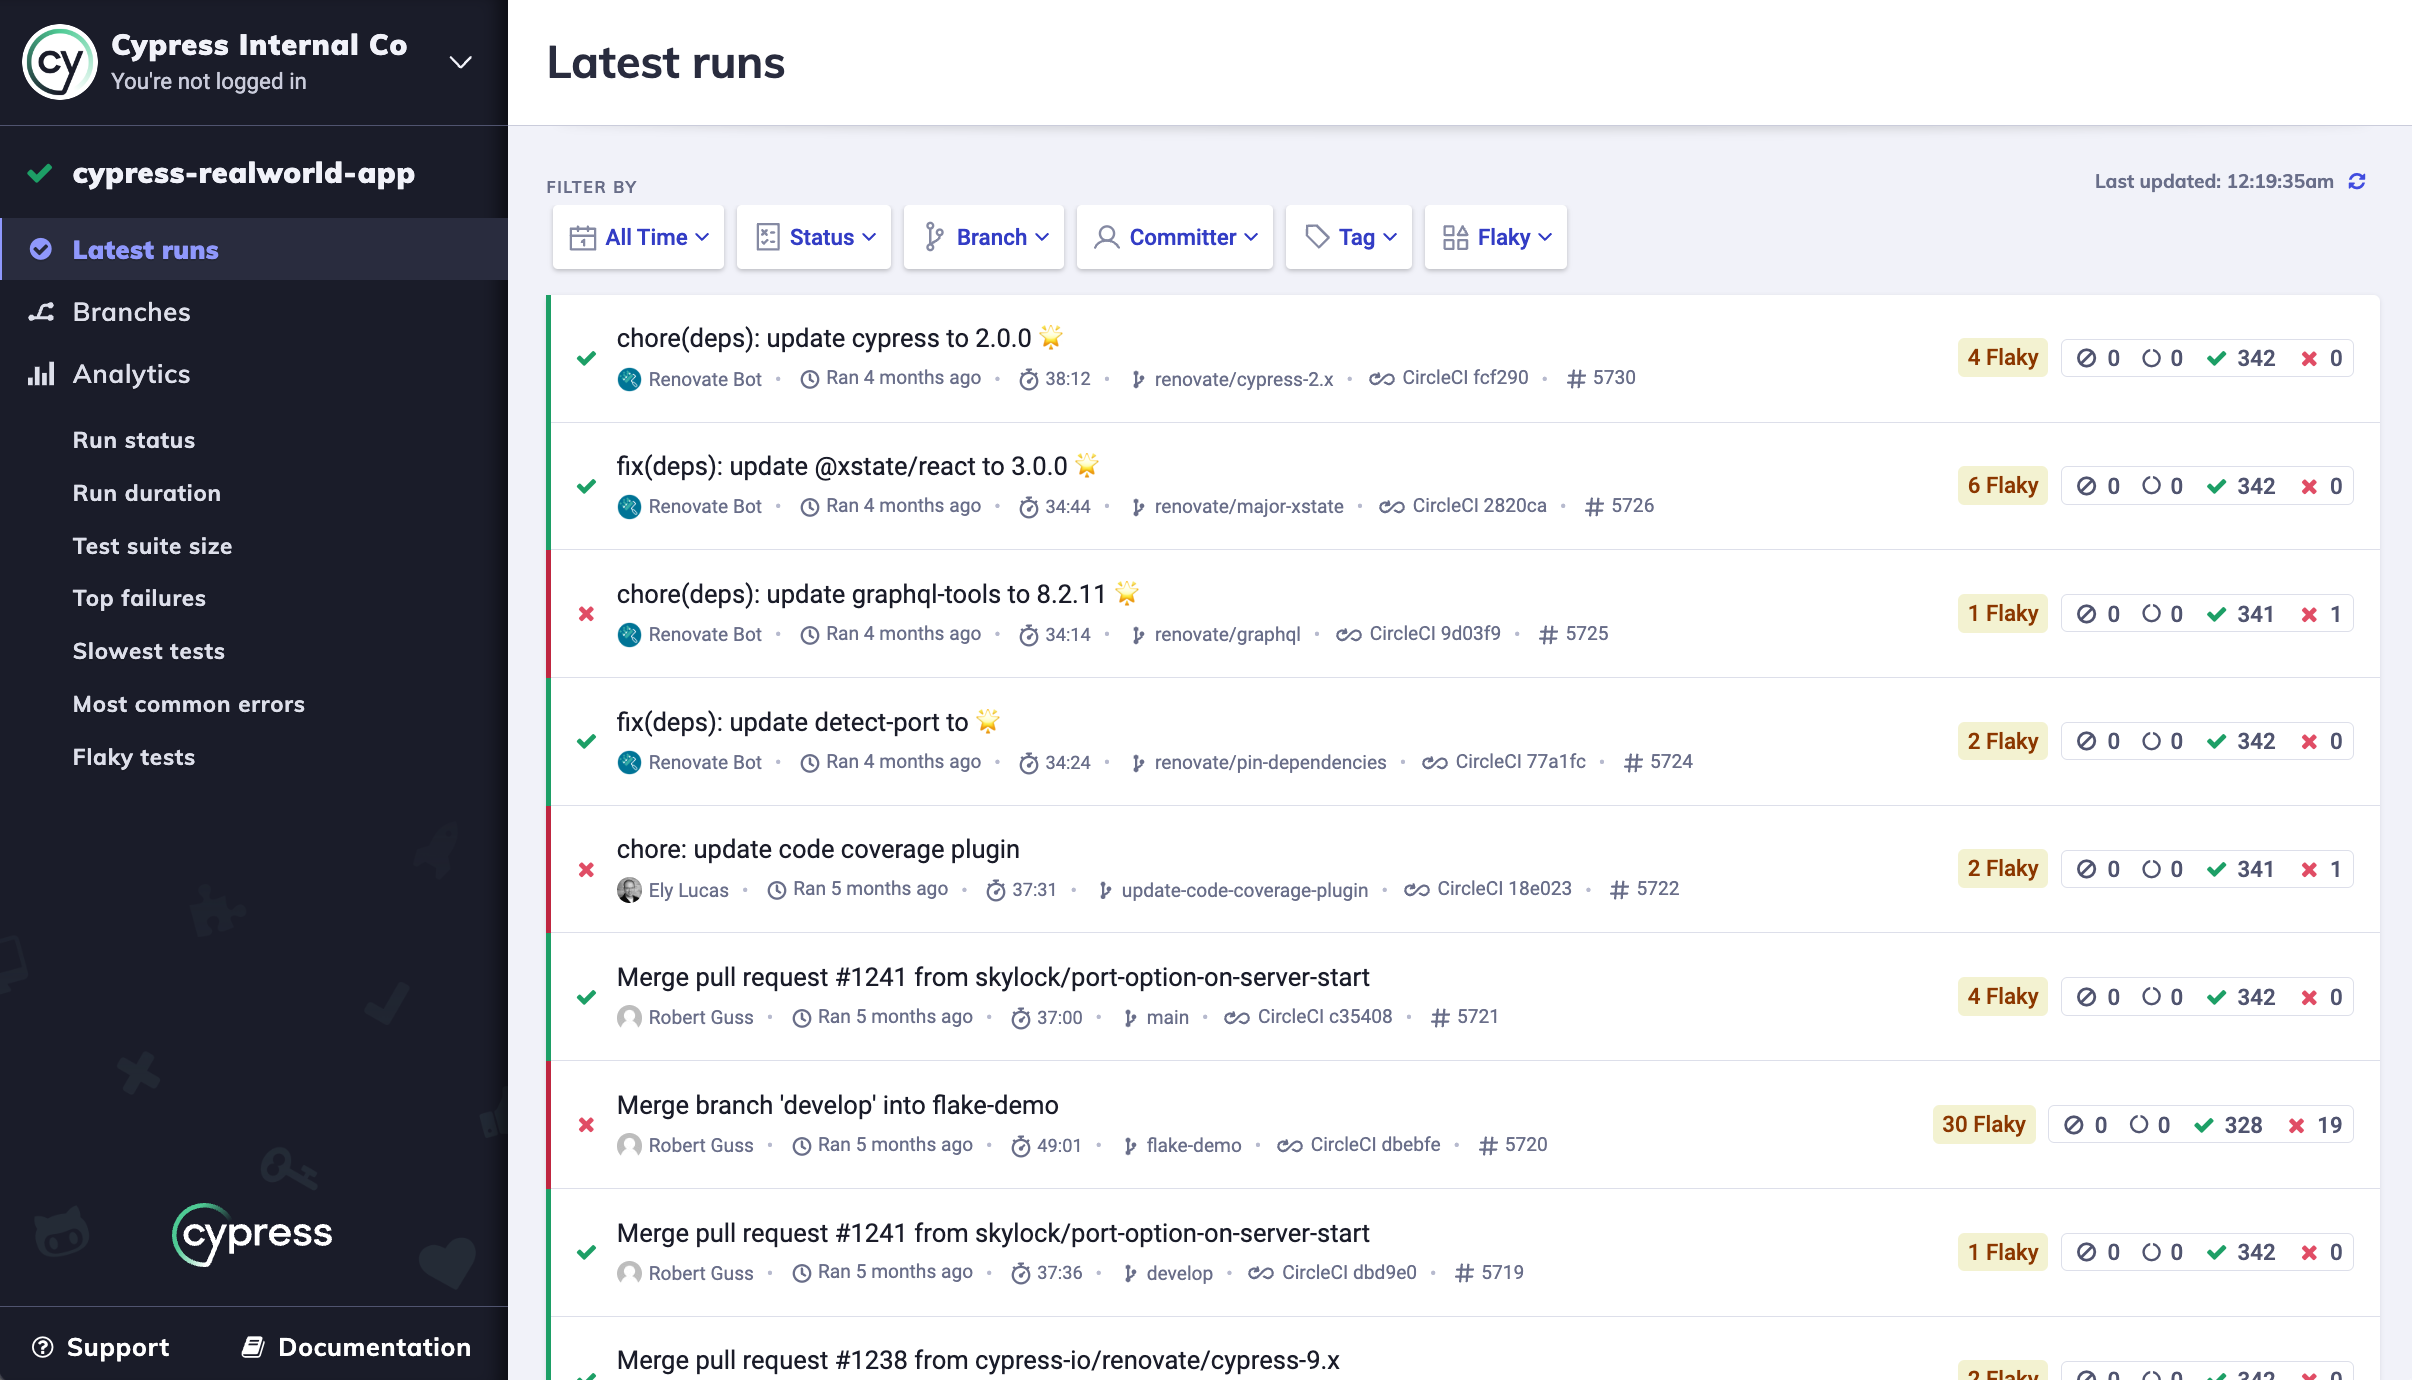
Currents provides more information: duration, flakiness indication, outcome, and commit details. In addition, Currents allows browsing test history further into the past and includes information about executions from all the branches.
- Currents: ✅
- Sorry Cypress: ❌
- Cypress Dashboard: ✅
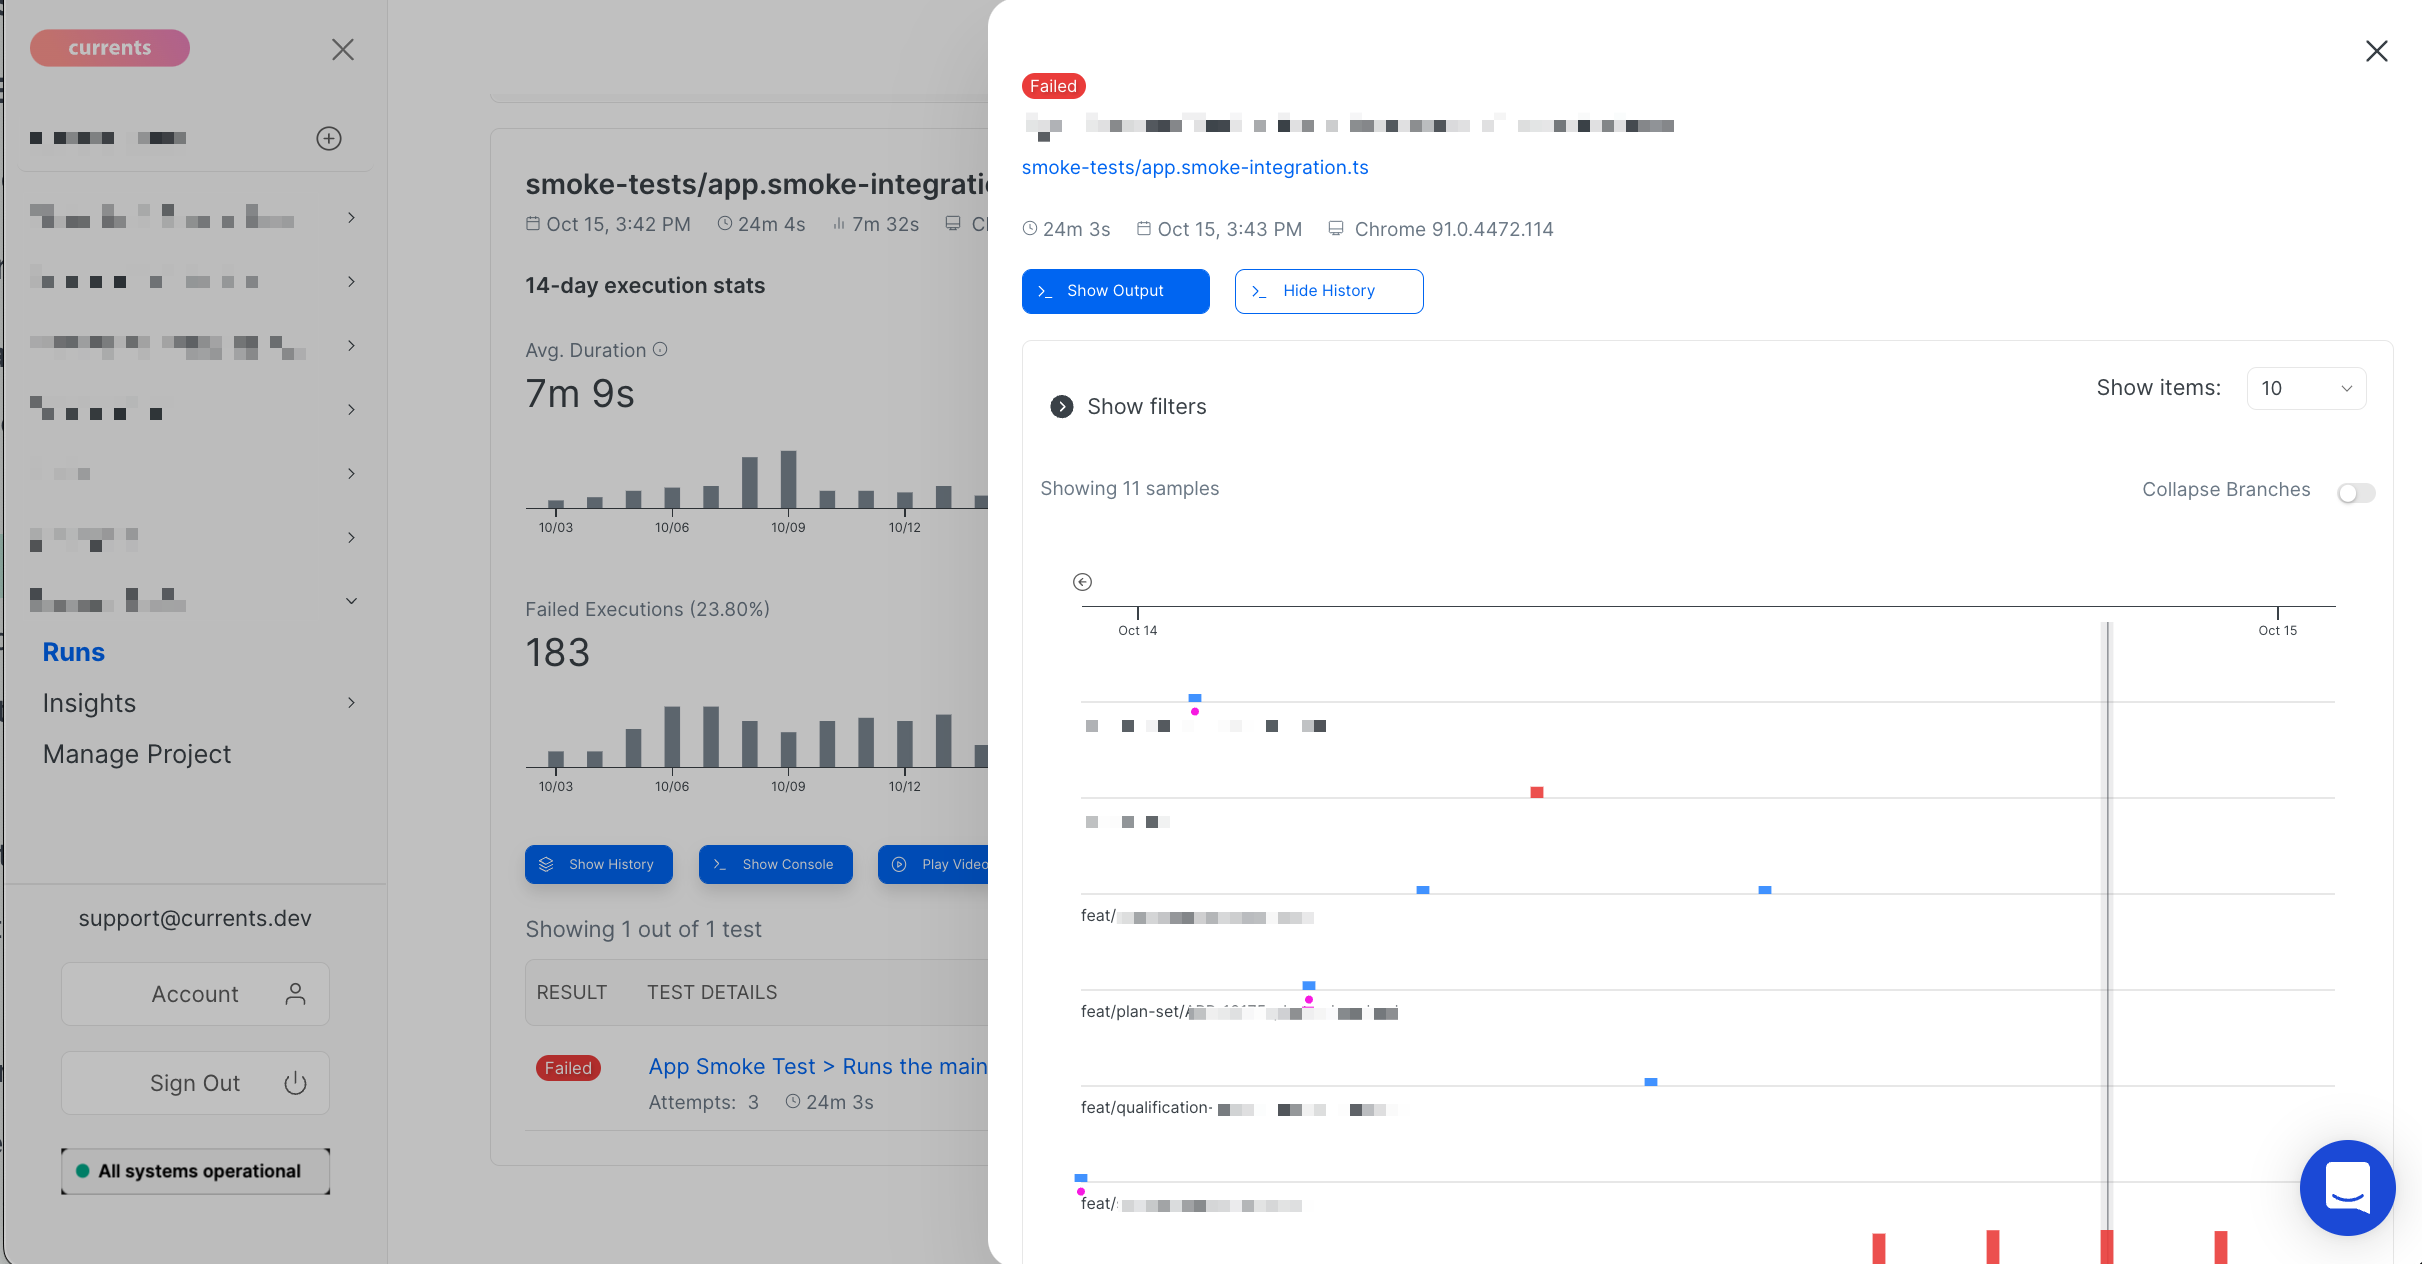
Spec Files History
Currents provides a unique ability to browse the execution history for each spec file. Similar to Test Runs History, you can explore past executions for each spec file: duration, flakiness indication, outcome, and commit details, including data collected from all the branches.
- Currents: ✅
- Sorry Cypress: ❌
- Cypress Dashboard: ❌
Test Source Code History
Cypress Dashboard is the only service that allows browsing test source code history. This feature may be useful for discovering what changes to source code could trigger a failure or performance issues for a given test.
- Currents: ❌
- Sorry Cypress: ❌
- Cypress Dashboard: ✅
Troubleshooting Comparison Table
| Feature | Cypress Dashboard | Sorry Cypress | Currents |
|---|---|---|---|
| Record Screenshots | ✅ | ✅ | ✅ |
| Record Videos | ✅ | ✅ | ✅ |
| CI Logs | ✅ | ❌ | ✅ |
| Error Stack Trace | ✅ | ✅ | ✅ |
| Test Runs History | ✅ | ❌ | ✅ |
| Spec Files Runs History | ❌ | ❌ | ✅ |
| Source Code History | ✅ | ❌ | ❌ |
Flaky Tests
Flaky Tests Detection
Flaky tests detection is supported by all three tools. A flaky test is an unreliable test that passes or fails across multiple retries of the test execution, despite no changes in the code. Suppose you executed a test, and it failed in the first run; then you execute it again without any code changes - and it unexpectedly passes.
Flaky tests are expensive to maintain - when they fail, they terminate the whole run, forcing reruns, waste of CI resources and reducing developers' confidence in tests' reliability.
To detect flaky tests, you must first enable automatic retries within Cypress configuration. When a flaky test is detected within a run, all 3 tools add a visual "flaky" indicator to allow you to fix them at your earliest.
- Currents: ✅
- Sorry Cypress: ✅
- Cypress Dashboard: ✅
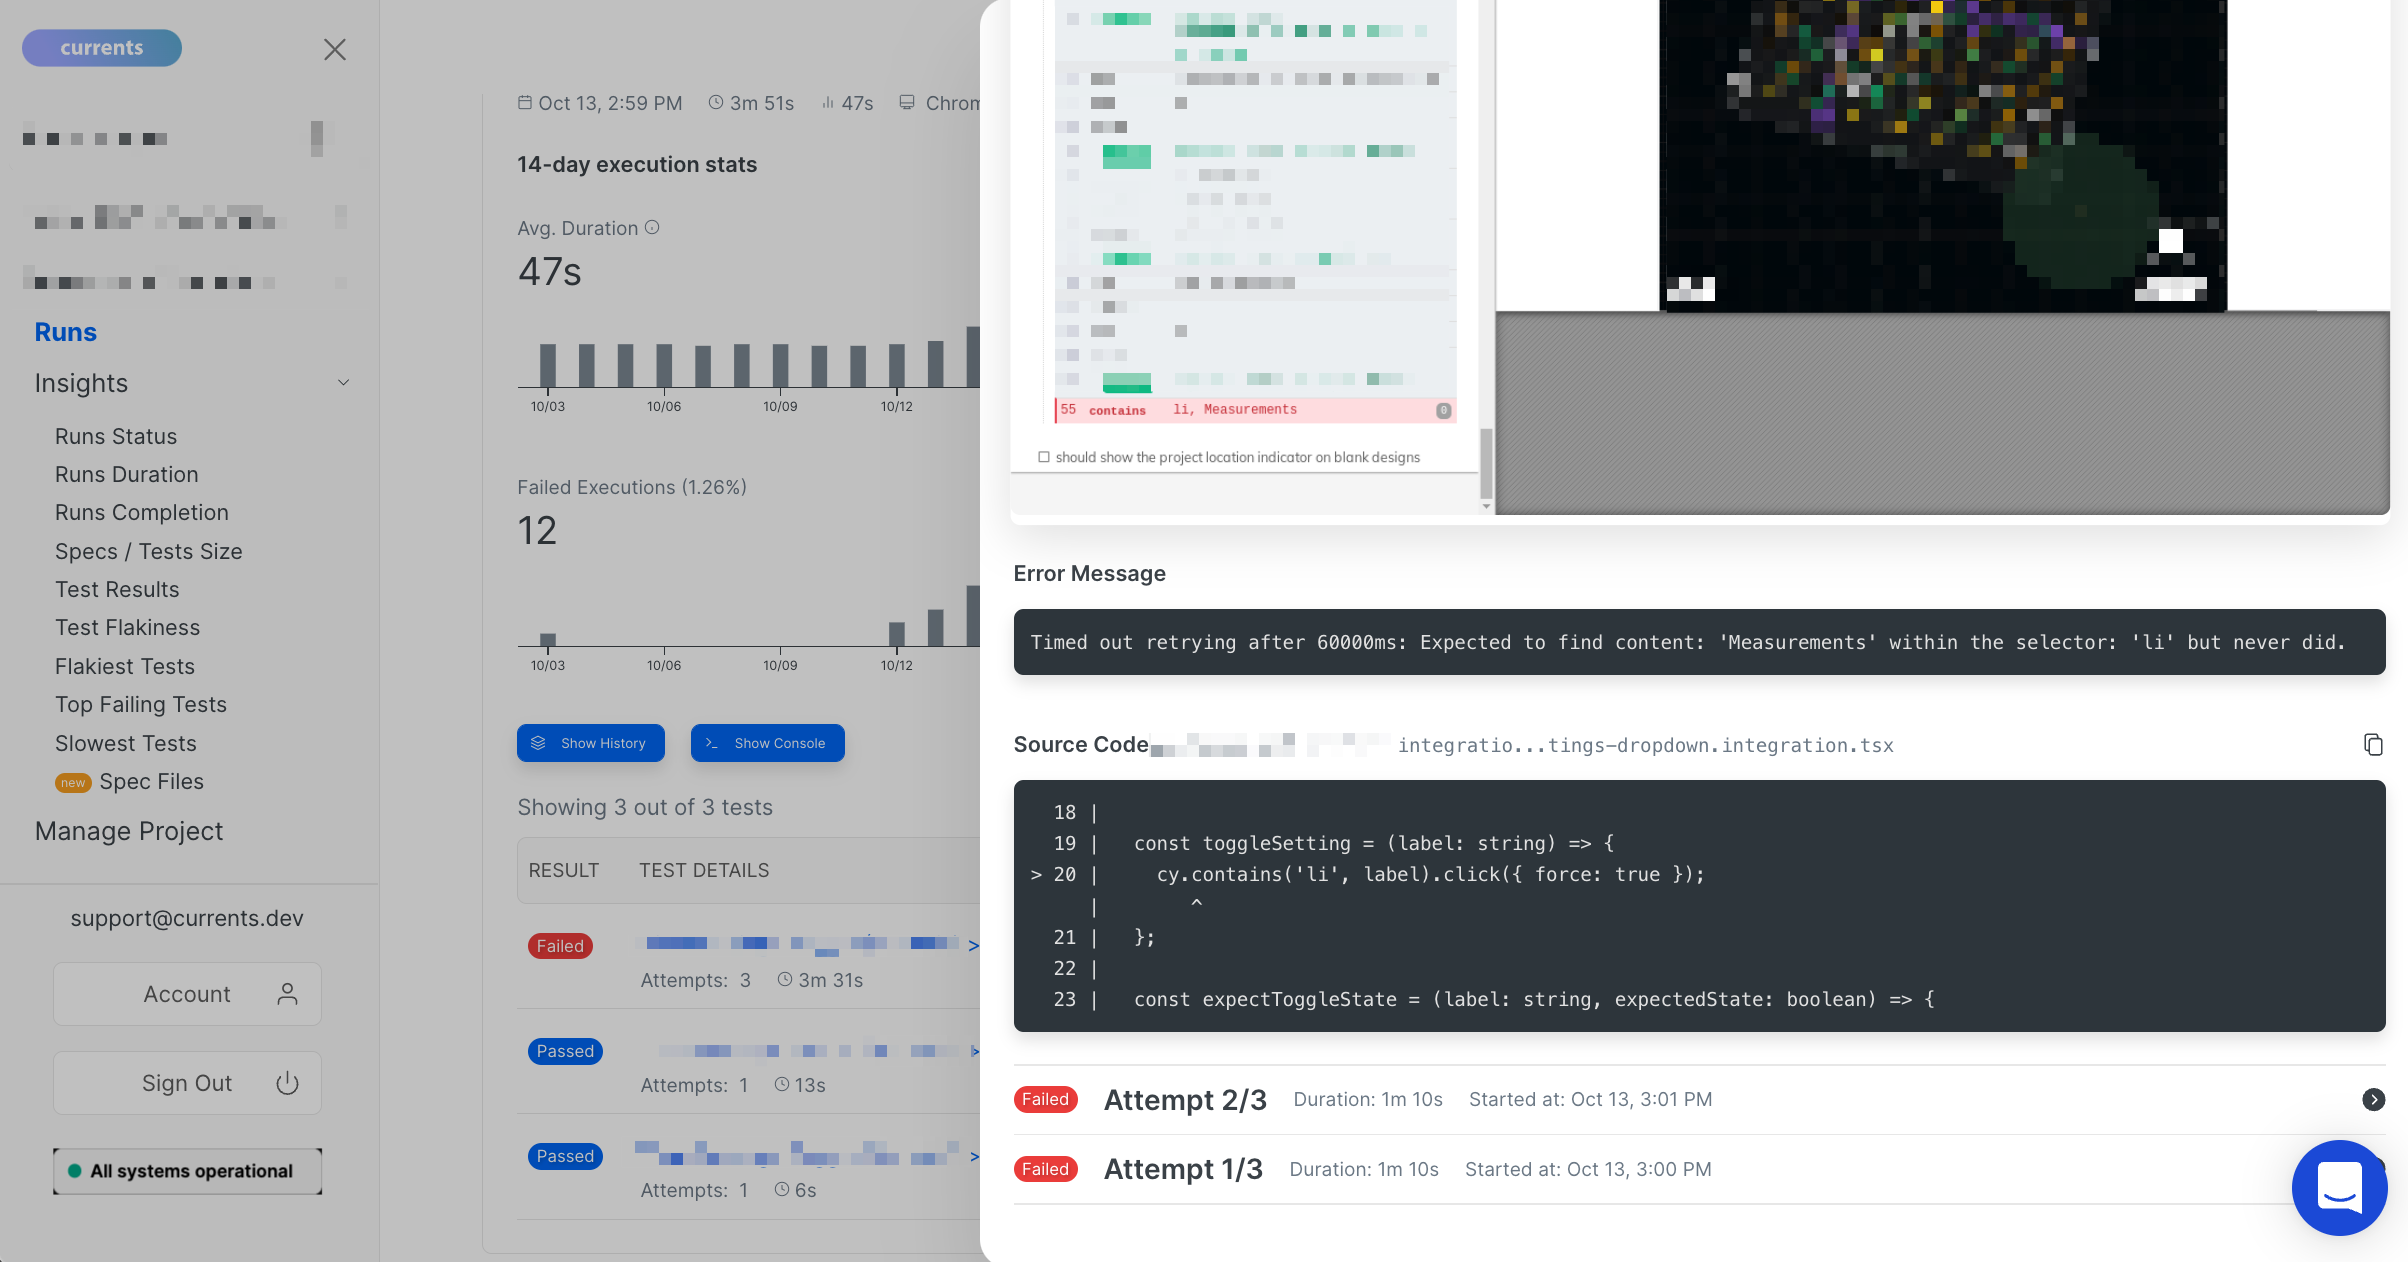
Flakiness Insights
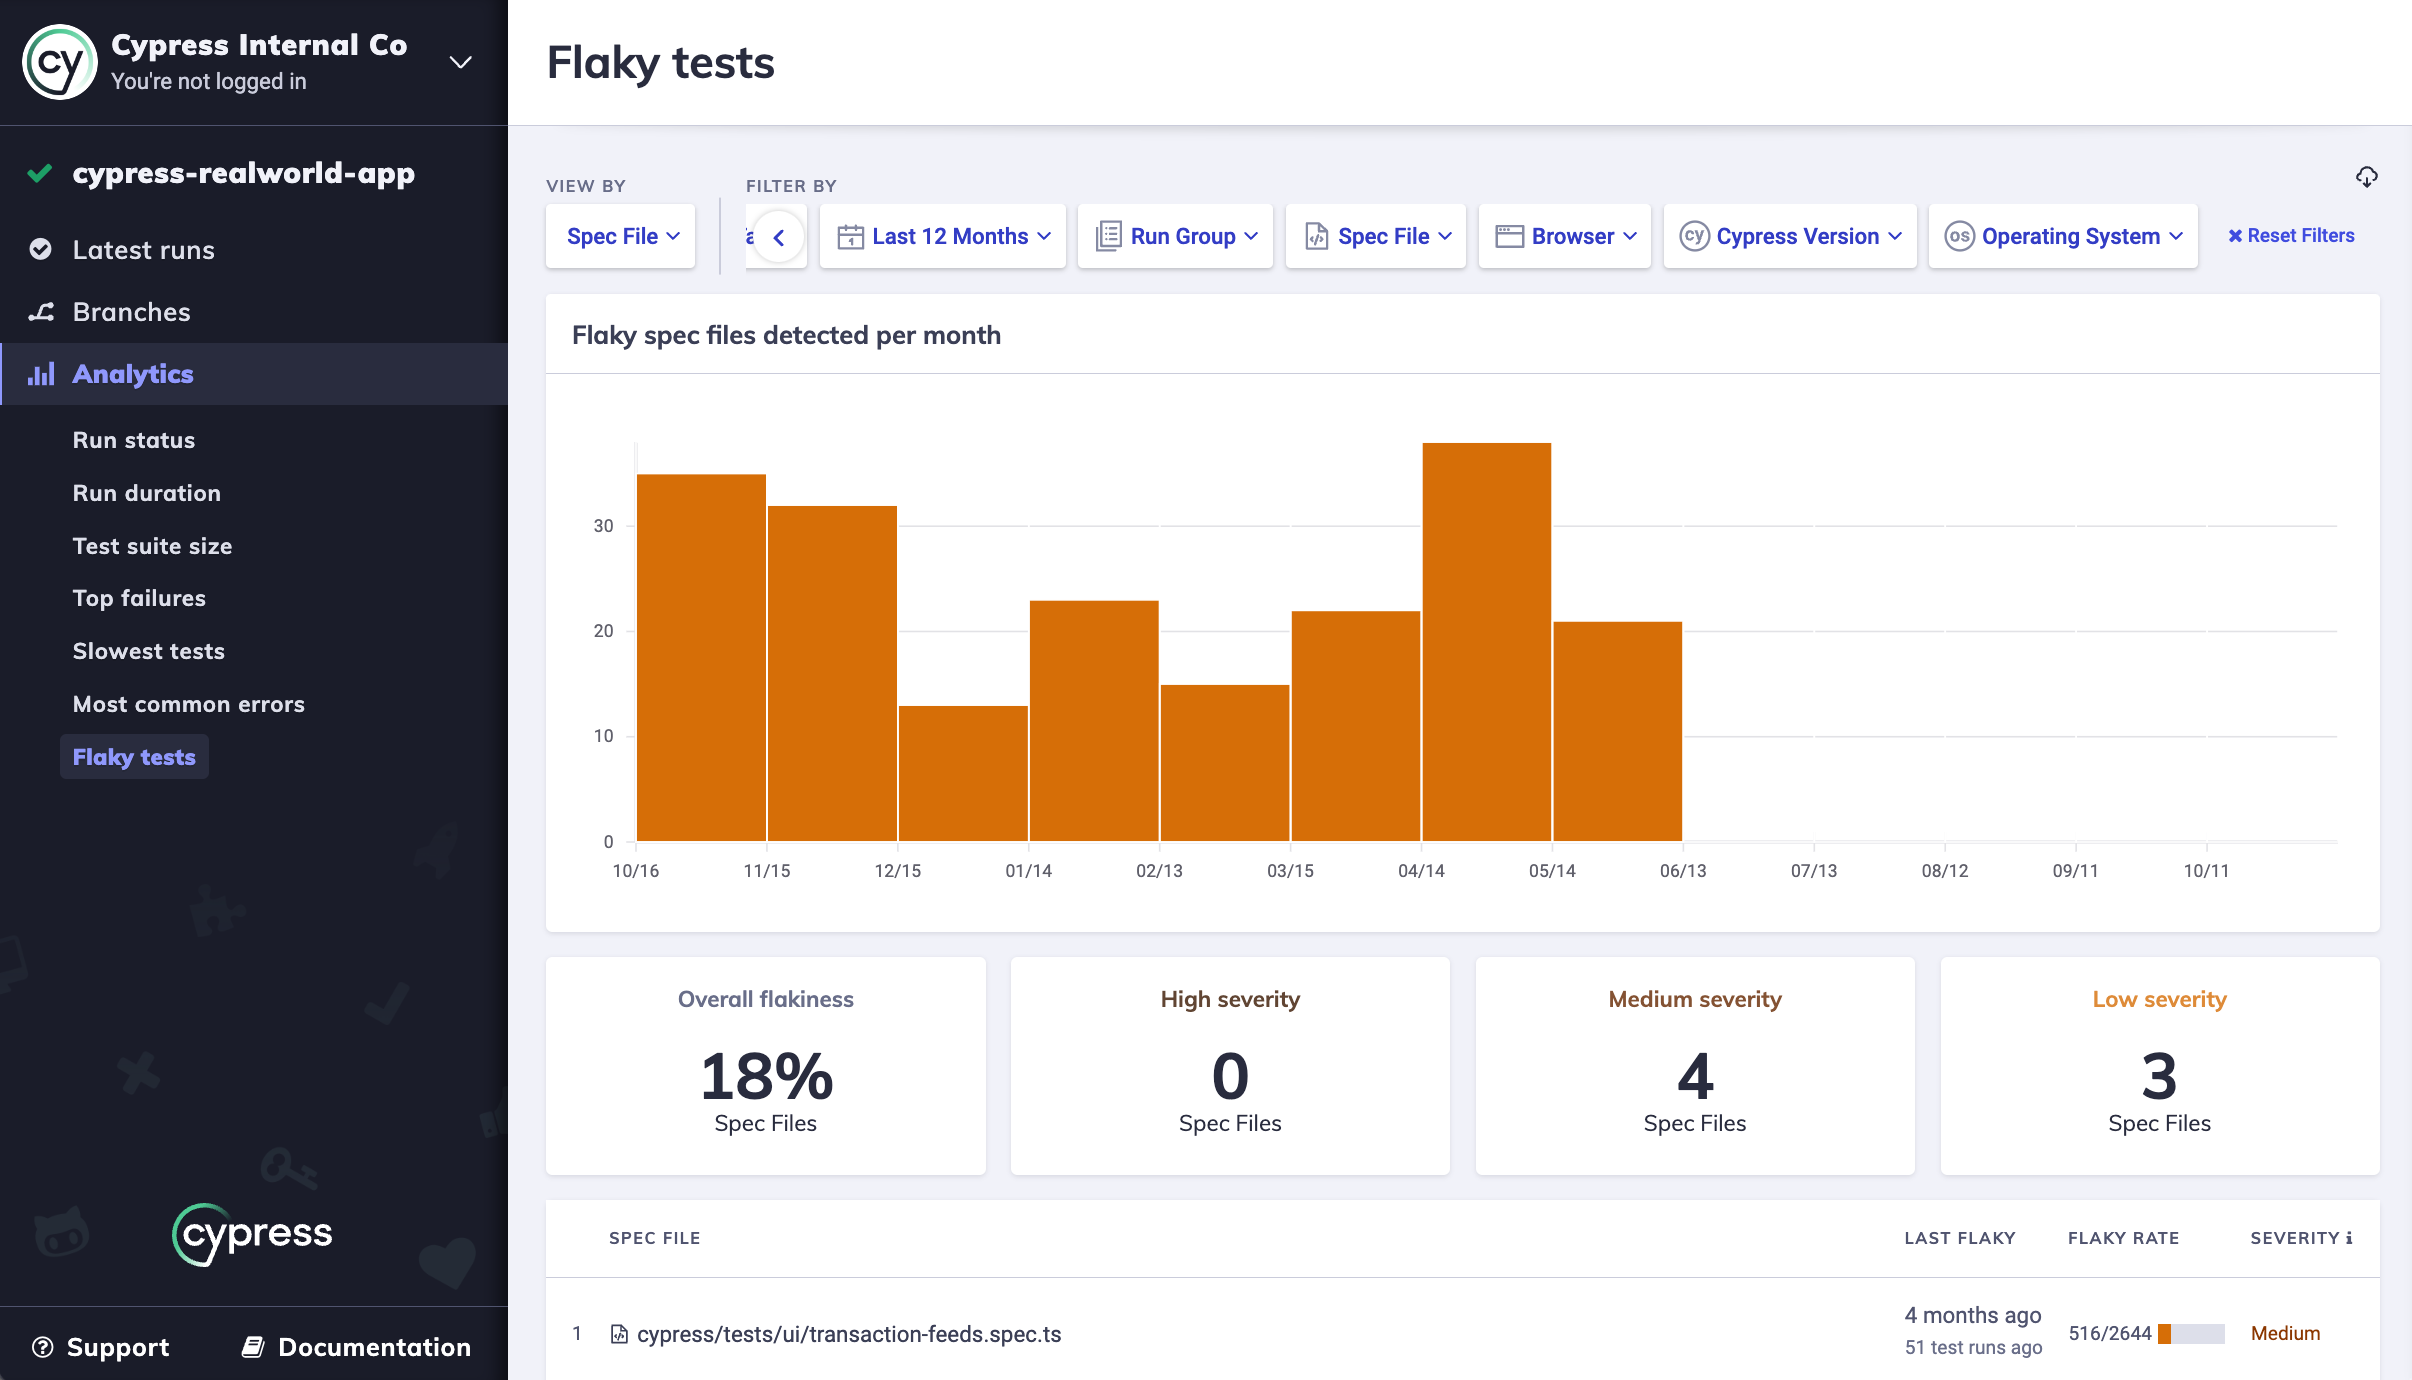
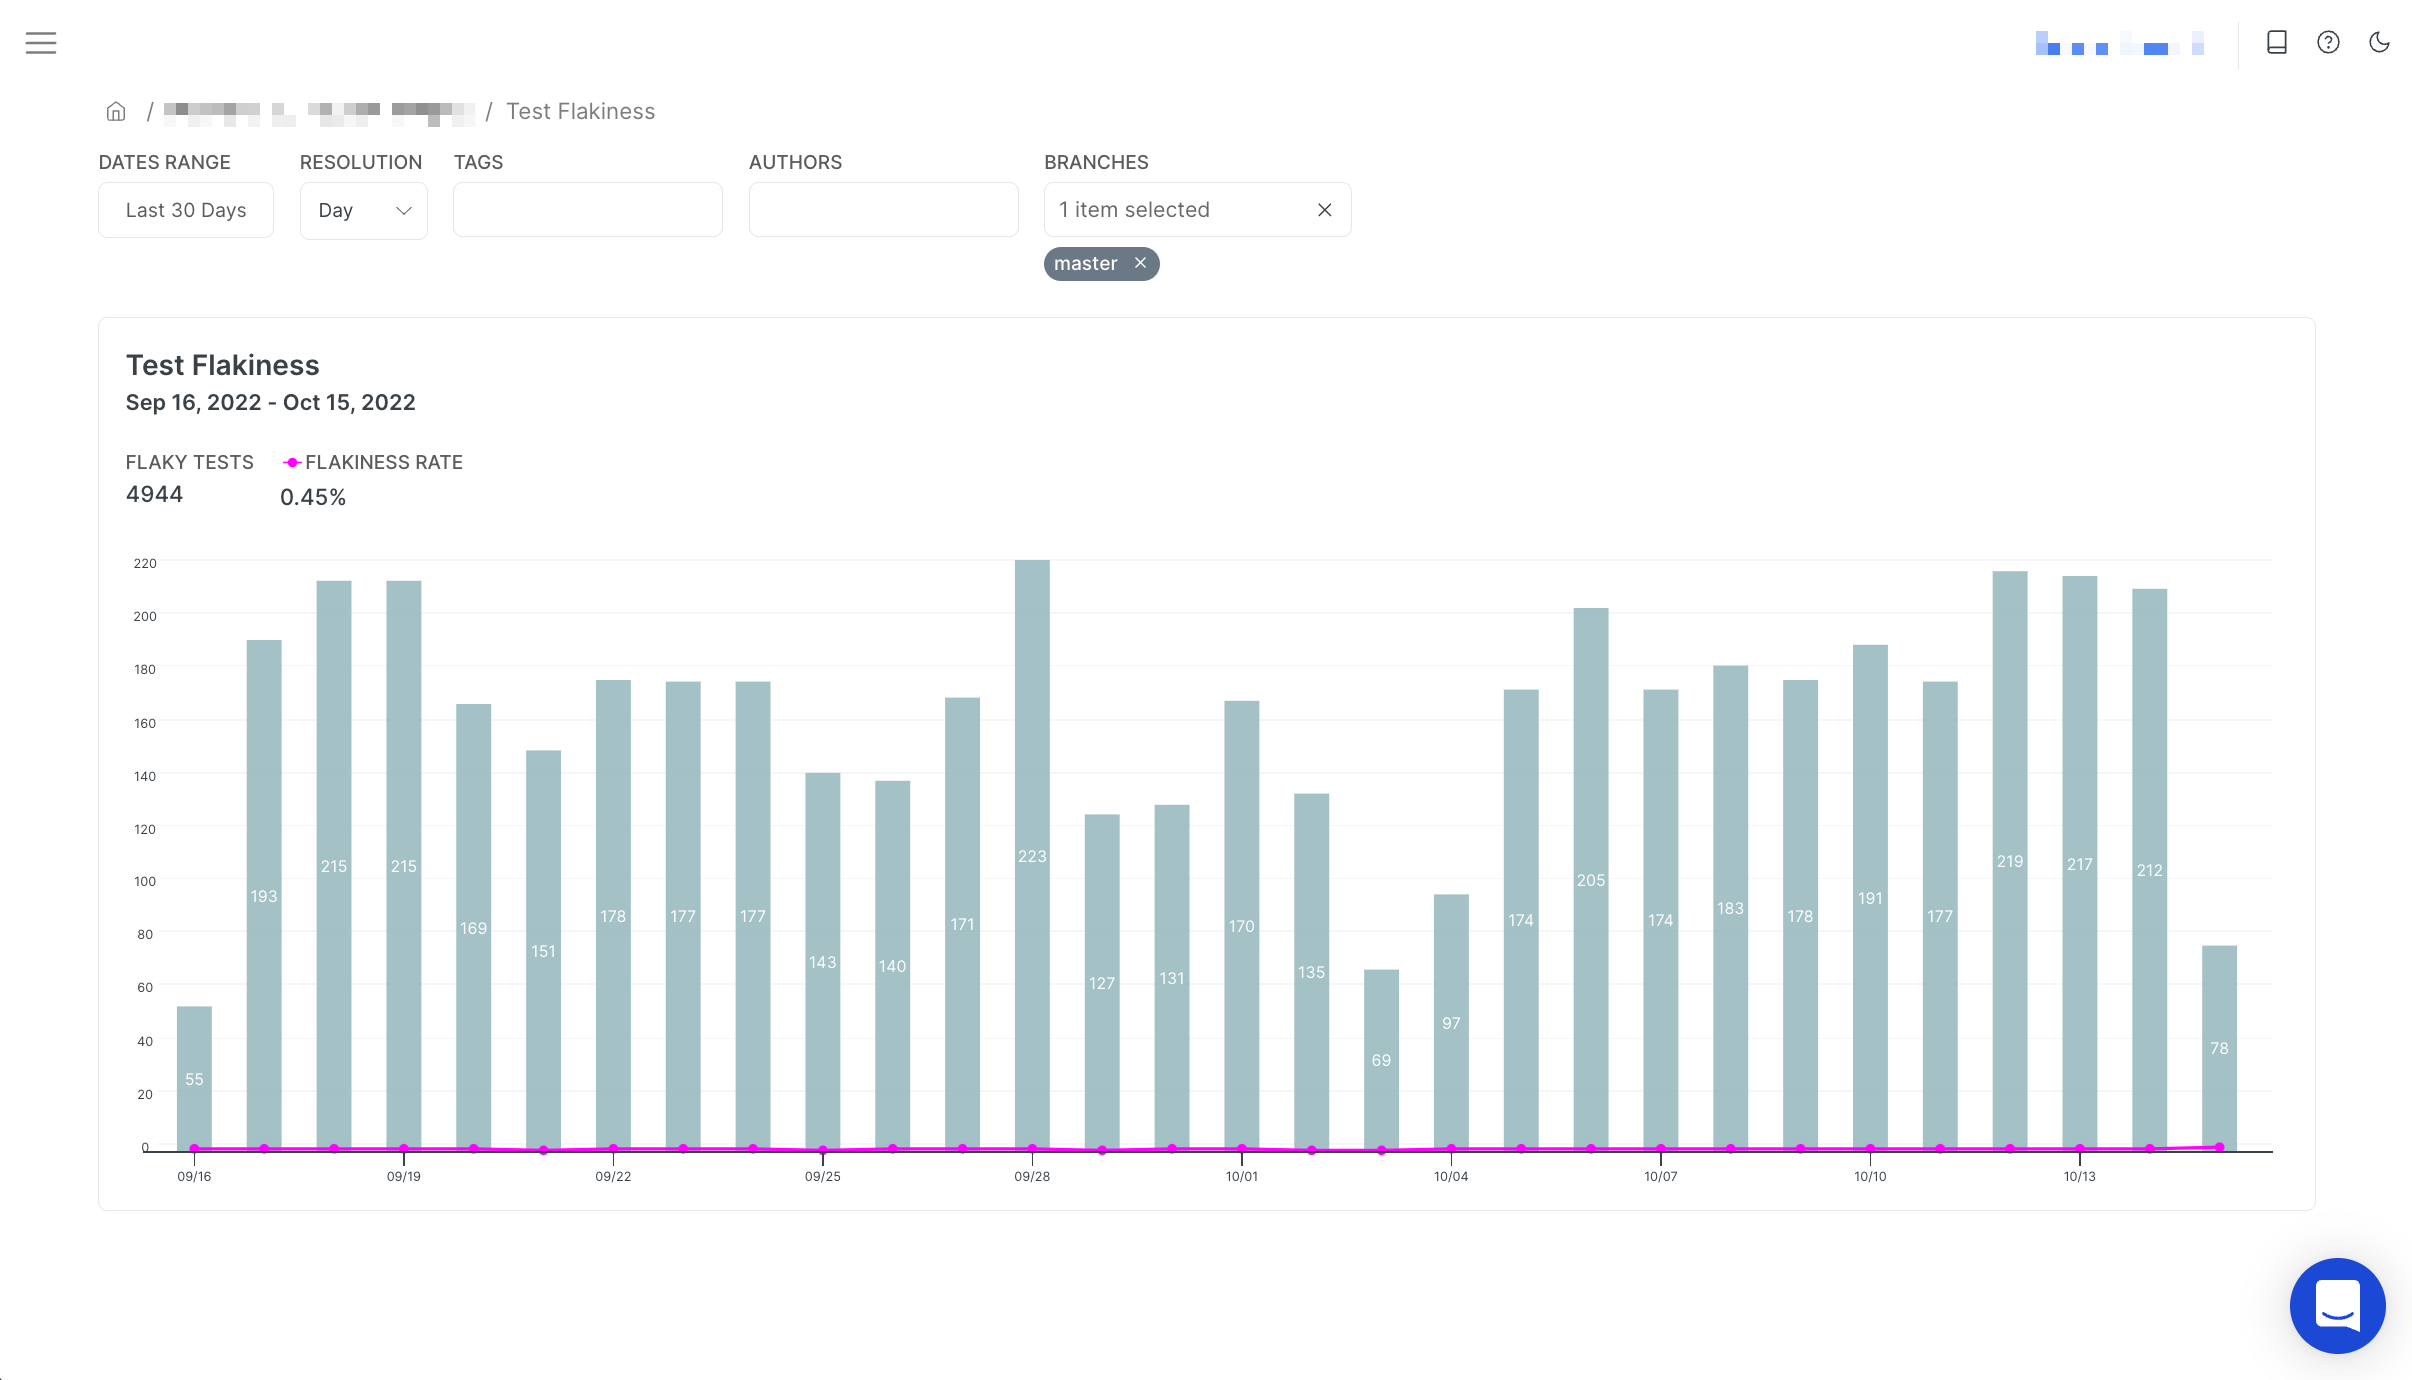
For bigger test suites and complex testing environments, it can be useful to manage flakiness at a macro level. Cypress Dashboard and Currents both provide flakiness management tools that aggregate flakiness metrics for a project, spec file and test levels.
The flaky tests analytics from Cypress Dashboard shows statistics like the number of flaky tests over time, overall flakiness, and the number of flakey tests or spec files grouped by severity. You can also explore an individual test flakiness rate and execution history.
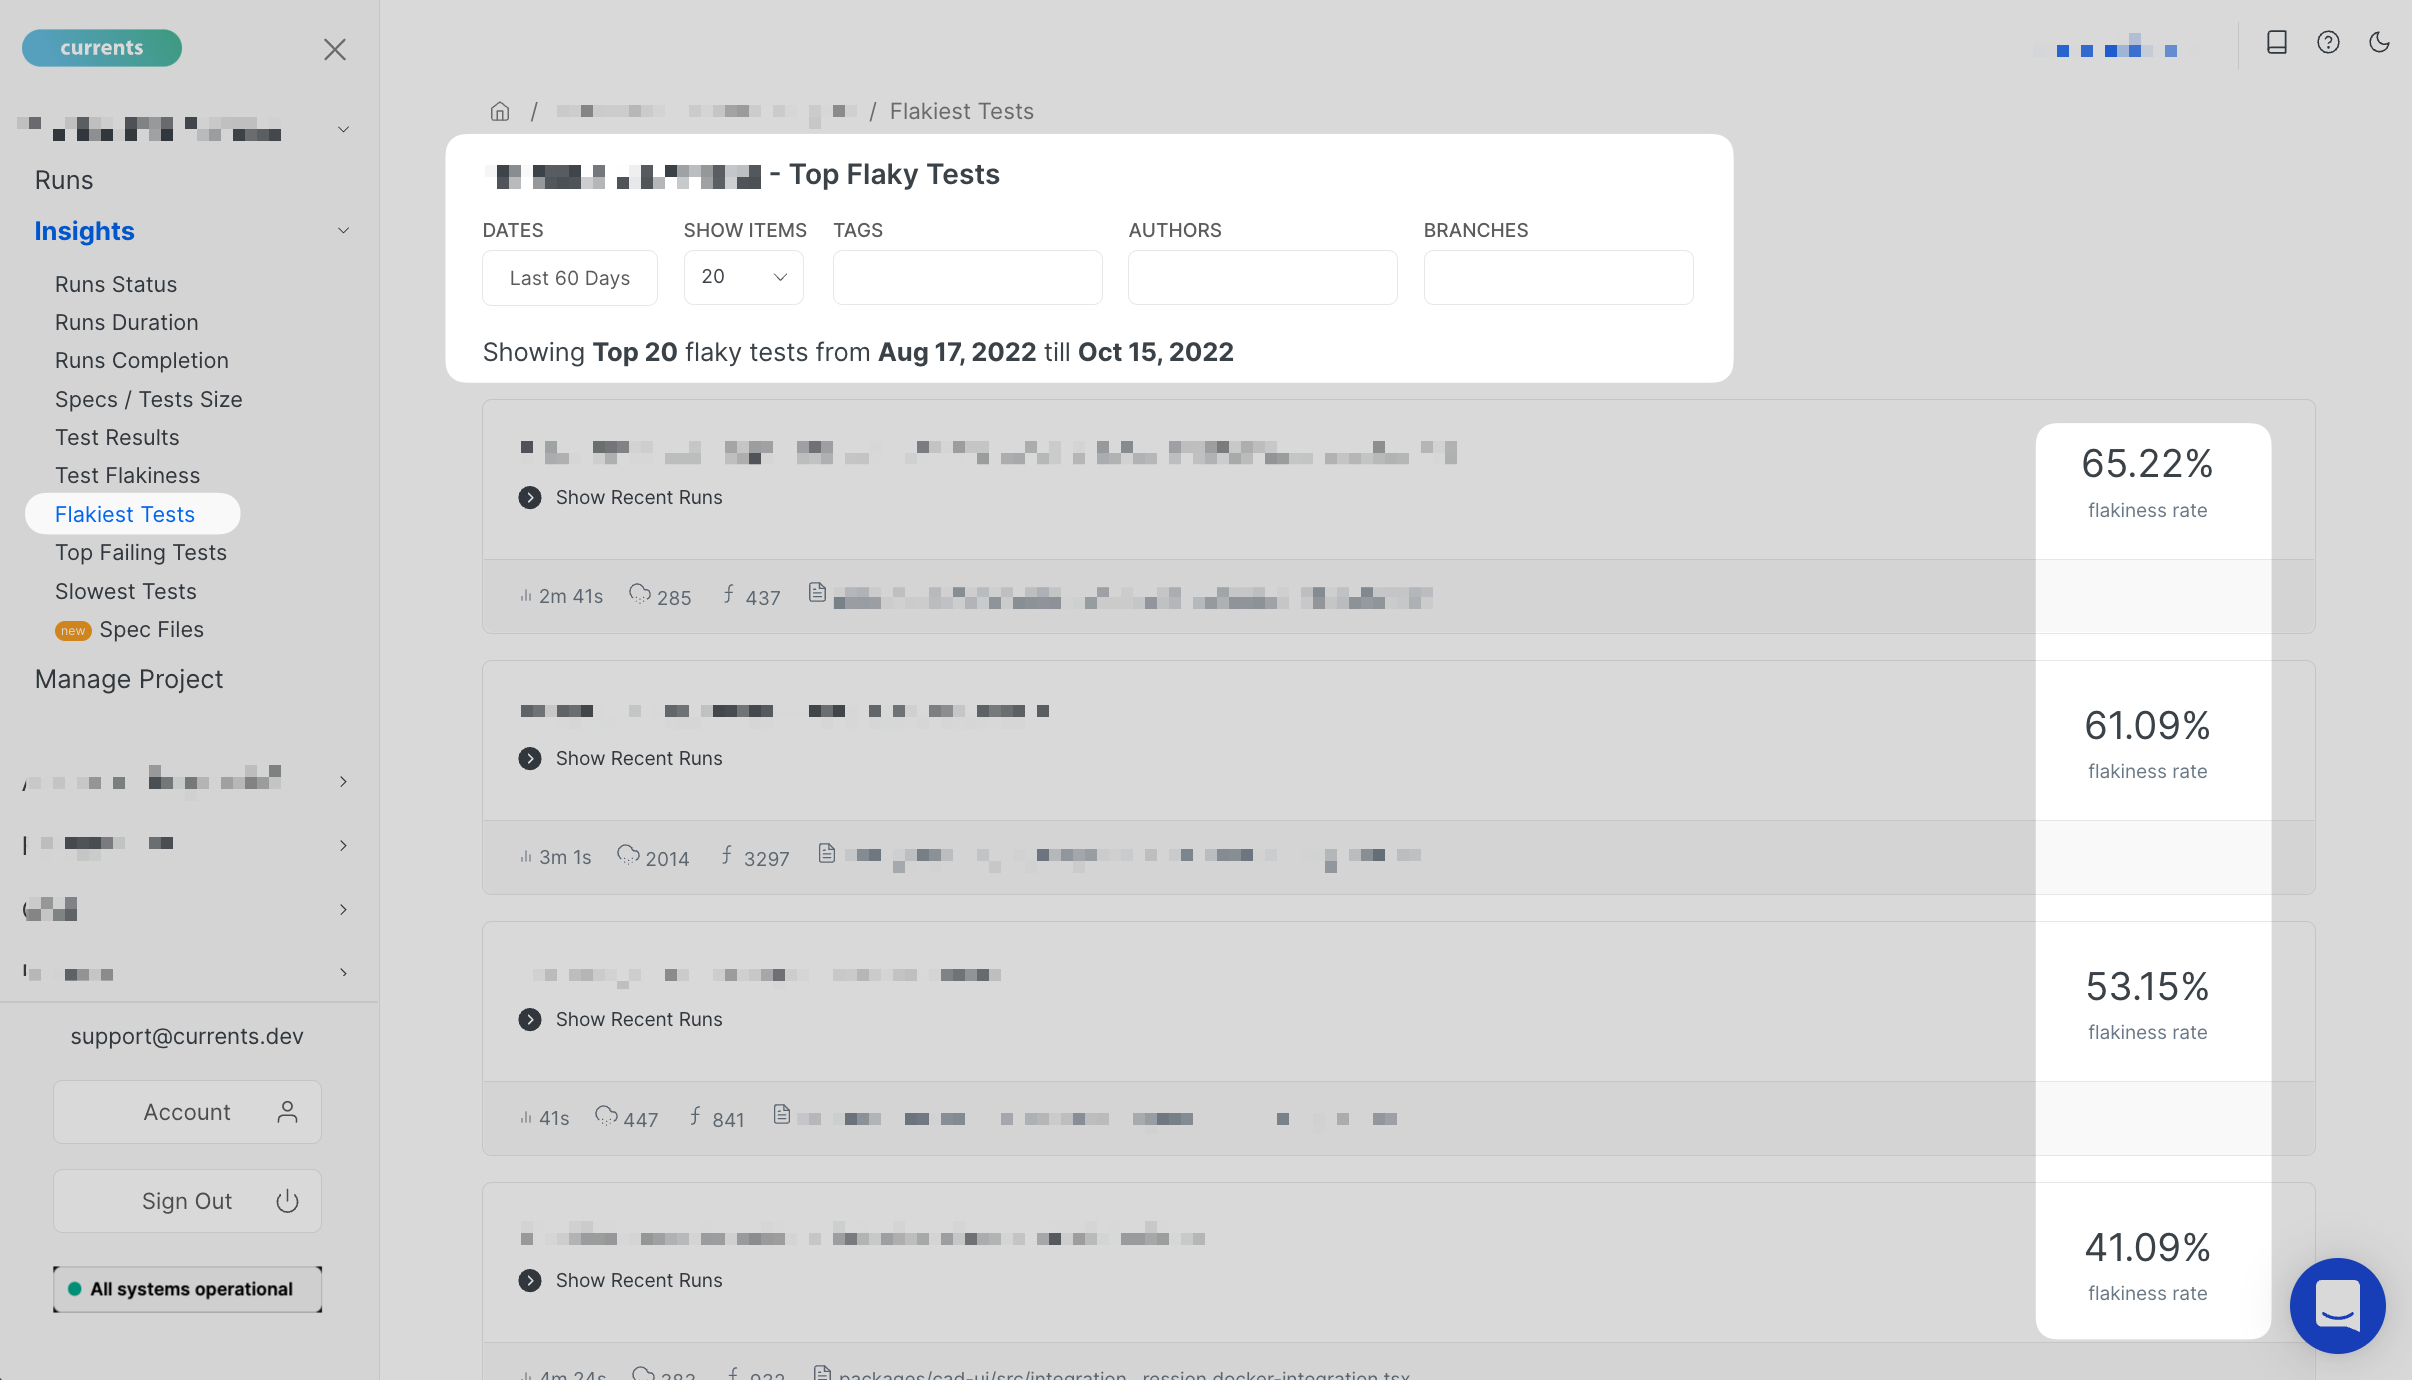
Currents has several powerful tools for helping you with managing flakiness. It provides test-level or spec-file-level flakiness and failure rate explorer, together with their execution history. It allows you to identify tests or spec files with the highest flakiness rate, filtered by tag, branch, or committer.
In addition, it also provides a project-level overview of flaky tests and the overall flakiness rate.
- Currents: ✅
- Sorry Cypress: ❌
- Cypress Dashboard: ✅
Flakiness Features Overview
| Feature | Cypress Dashboard | Sorry Cypress | Currents |
|---|---|---|---|
| Flaky Tests Detection | ✅ | ✅ | ✅ |
| Flakiness Management tools | ✅ | ❌ | ✅ |
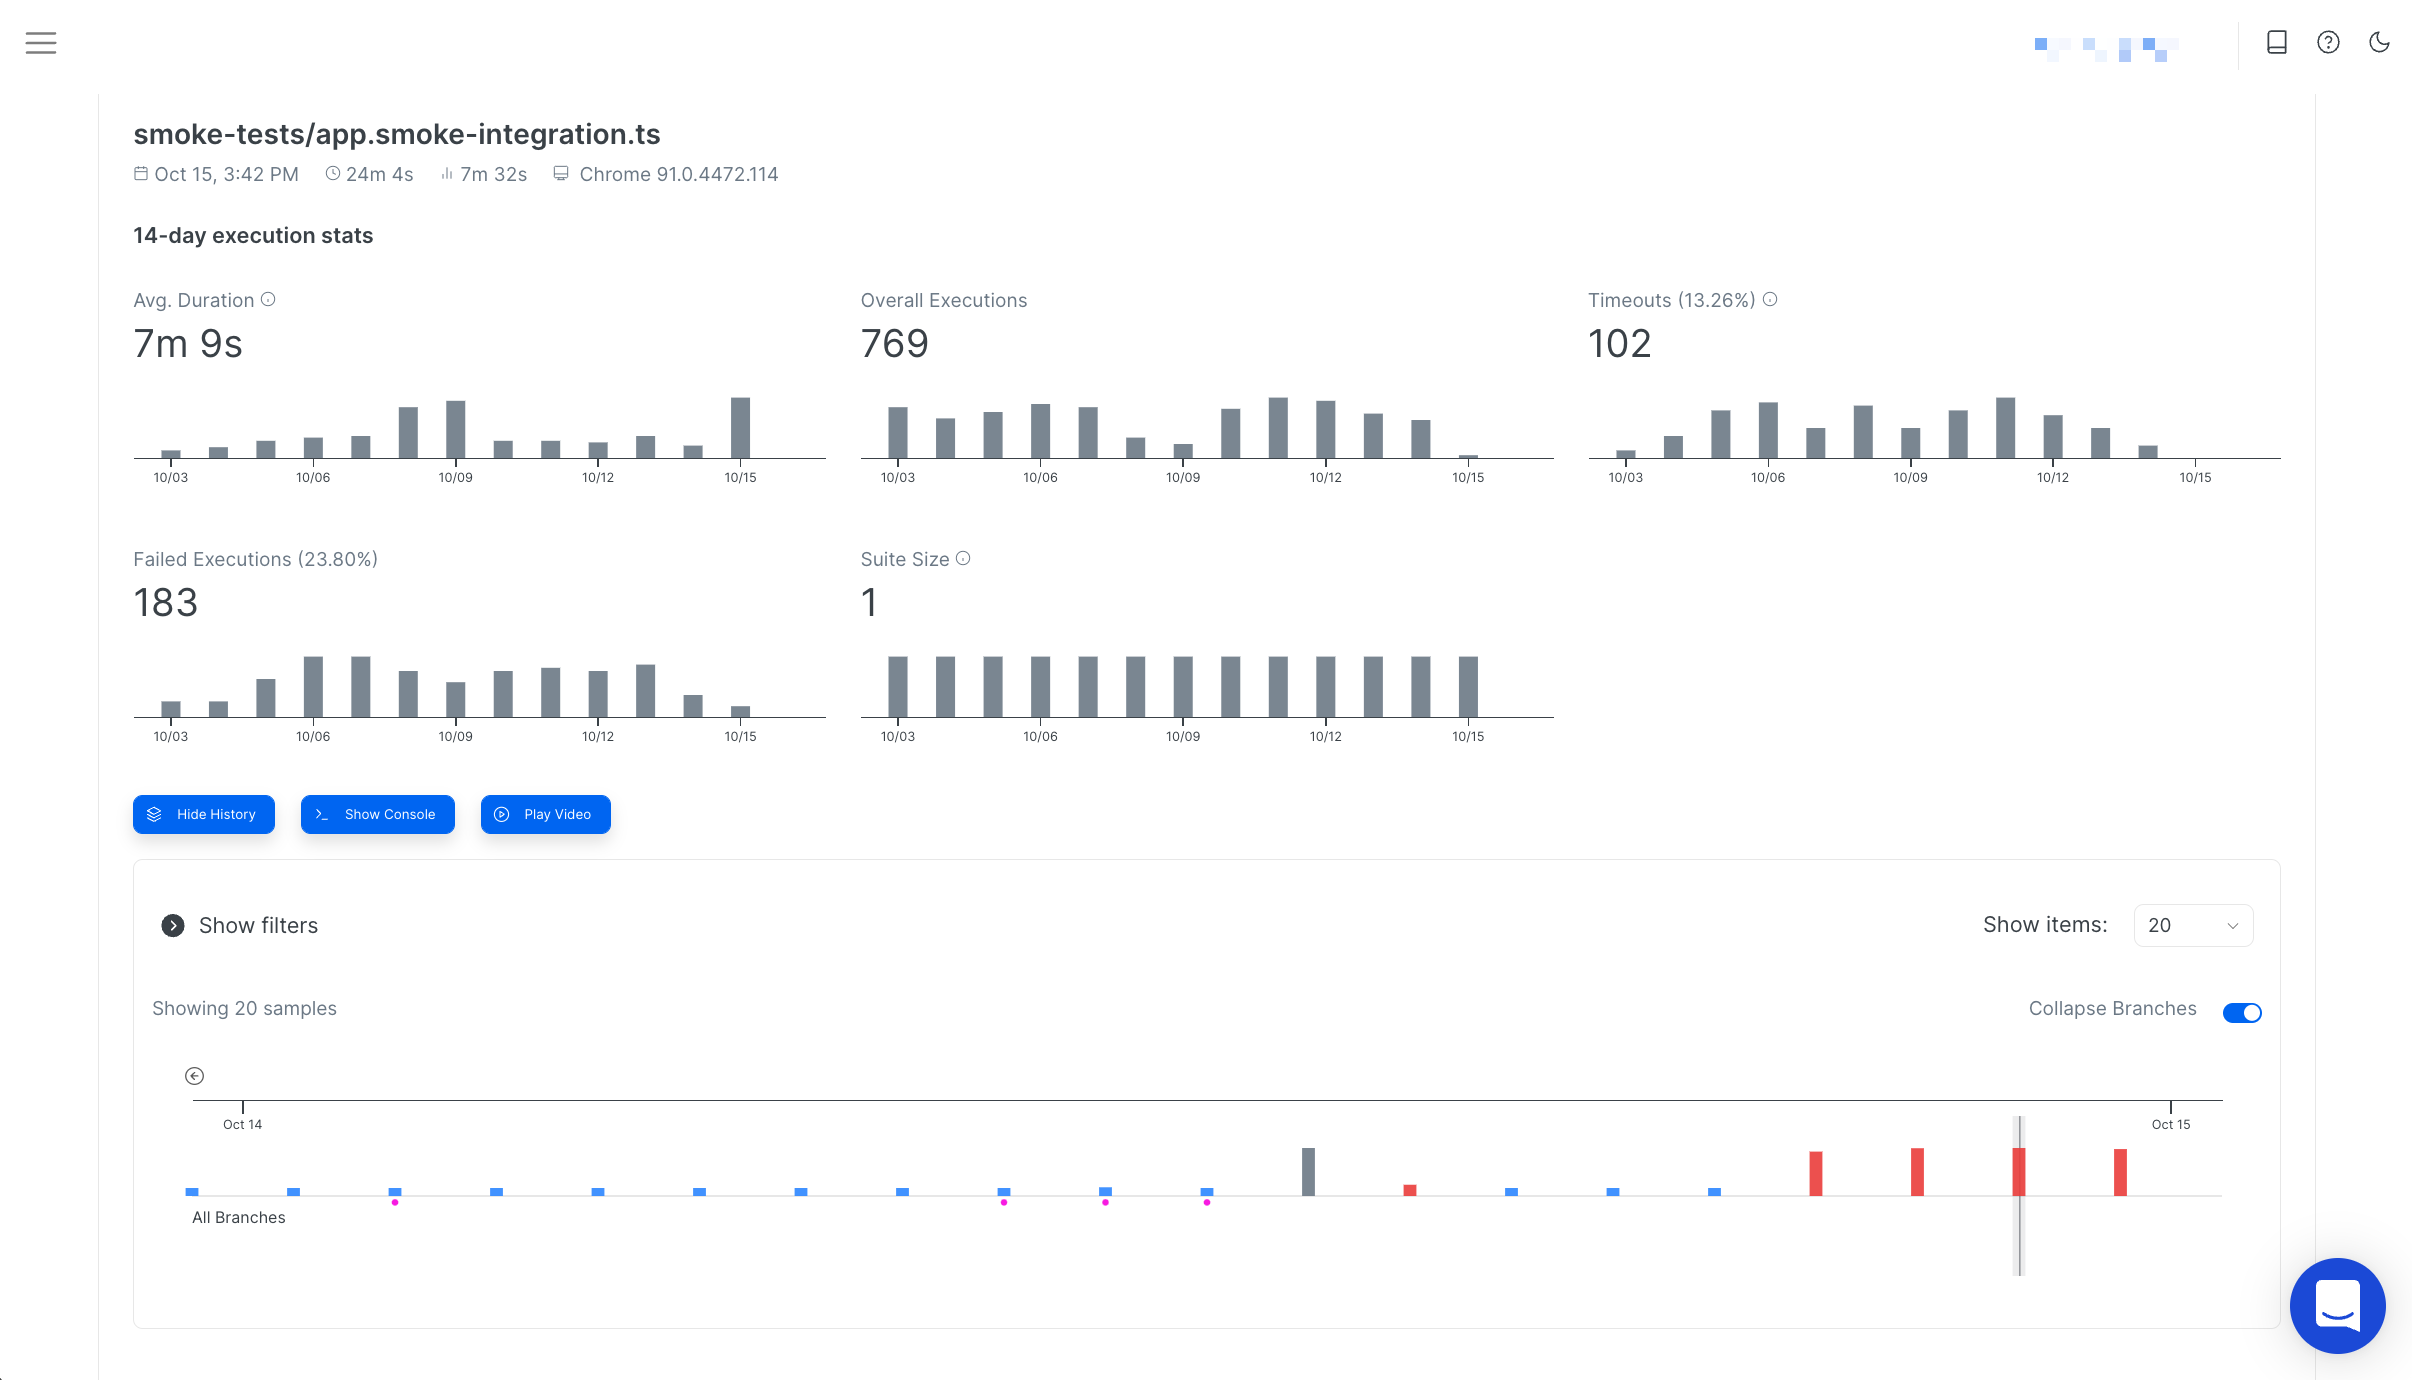
Environment and Build Information
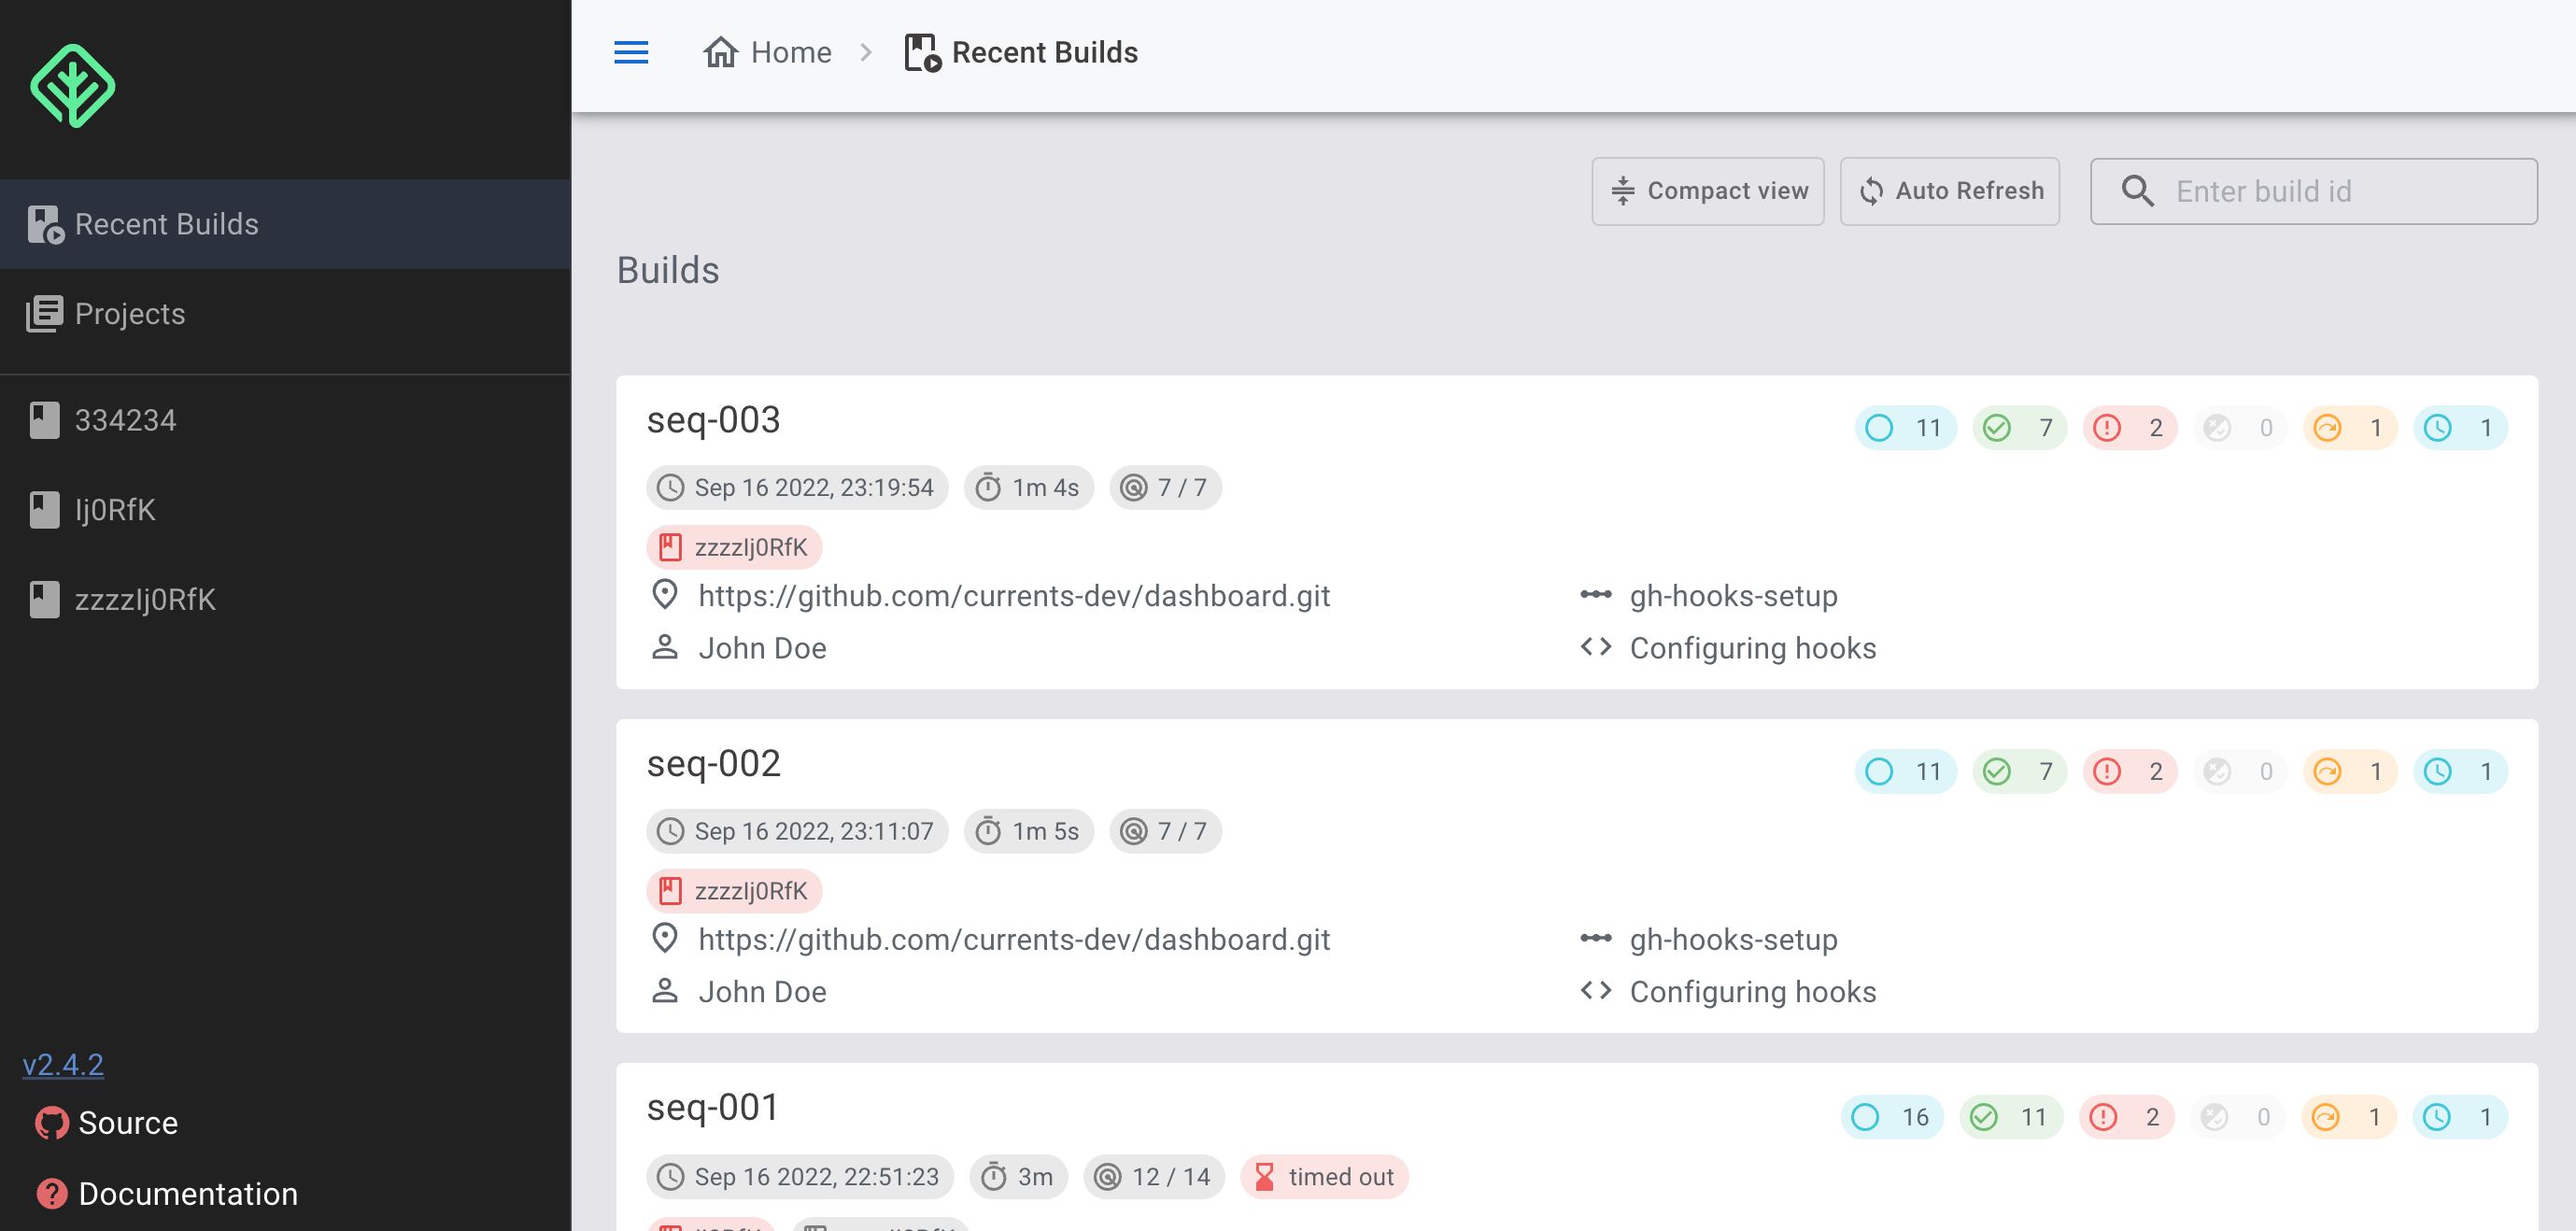
The tools allow users to explore the details of build execution and progress.
- Git Information - for each build, you can see information like author name, commit message, branch name, and PR details
- Environment Information - browser and device information for each build
- Run/Spec/Test Duration - duration of your builds, spec files, and the time spent on each test
- Expected Duration - show the expected duration which is based on historical data
- Machines Distribution - real-time distribution of tests across the CI machines
The timeline view lets users view parallel test execution, and the bar chart view makes it easier to view longer-running tests. Cypress Dashboard and Current also integrate with historical data like expected duration to enhance the experience.
| Feature | Cypress Dashboard | Sorry Cypress | Currents |
|---|---|---|---|
| Progress / Status | ✅ | ✅ | ✅ |
| Git Information | ✅ | ✅ | ✅ |
| Environment Information | ✅ | ✅ | ✅ |
| Run/Spec/Test Duration | ✅ | ✅ | ✅ |
| Expected Duration | ✅ | ✅ | ✅ |
| Machines Distribution | ✅ | ❌ | ✅ |
Integrations
GitHub + GitHub Enterprise Integration
The tools can seamlessly integrate with GitHub, providing timely updates about tests execution progress and results:
- Commit Status updates
- PR comments
Commit Status updates indicate the health of a commit within a repository.
PR Comments provide detailed information about your test results within the PR comments section. For example - the number of passed, failed, skipped, or flaky tests, the status of the final test run, OS and browser visions, the first ten failure runs, and many more. Only Cypress Dashboard and Currents implement posting PR comments.
GitHub Enterprise integration is only included in Cypress Dashboards’ Business and Enterprise paid pricing plans. In contrast, Currents include it in all the plans, and Sorry Cypress provides it free of charge.
- Currents: PR Comments ✅, Status Checks ✅
- Sorry Cypress: PR Comments ❌, Status Checks ✅
- Cypress Dashboard: PR Comments ✅, Status Checks ✅
GitLab + Self-Hosted GitLab Integration
Only Cypress Dashboard and Currents have GitLab Integration. GitLab commits statuses ad Merge request comments (MR) are enabled by default. Commit status contains the test result to avoid merging failing tests. In addition to statuses, the integration indicates any flake tests to avoid merging flaky tests.
MR comments provide a test run summary with statistics like test counts, run info, and a failed or flaky test summary.
- Currents: MR Notes ✅, Status Checks ✅
- Sorry Cypress: ❌
- Cypress Dashboard: MR Notes ✅, Status Checks ✅
Slack Integration
Slack integration promotes cross-team collaboration and reduces the time to find failed tests - it is available in Currents, Cypress Dashboard, and Sorry Cypress. While the integrations vary by the amount configuration options, in general, they are quite similar in purpose - posting build results to your organization's Slack channel.
- Currents: ✅
- Sorry Cypress: ✅
- Cypress Dashboard: ✅
Bitbucket Integration
The tools can integrate with Bitbucket + Enterprise, posting commit status updates However, only Cypress Dashboard supports posting PR comments for BitBucket integrations.
- Currents: PR comments ✅, Status Checks ❌
- Sorry Cypress: PR comments ✅, Status Checks ❌
- Cypress Dashboard: MR Notes ✅, Status Checks ✅
Jira
Cypress Dashboard is the only tool that natively integrates with Jira - it allows create Jira issues for a specific test case and allows one to explore Jira ticket history.
- Currents: ❌
- Sorry Cypress: ❌
- Cypress Dashboard: ✅
HTTP Webhooks
HTTP Webhooks allow you to implement custom integrations that are not provided out-of-the-box. For example, you can automatically create a ticket in your bug tracking system based on the results of incoming webhook, or store test run results in a data lake for analysis and improvements. Only Currents provides HTTP Webhooks integration.
- Currents: ✅
- Sorry Cypress: ✅
- Cypress Dashboard: ❌
REST API
In addition to HTTP Webhooks, you can access your test results and artifacts programmatically using Currents' REST API. That unlocks even more possibilities for customizing and integrating Currents into your team's workflow.
- Currents: ✅
- Sorry Cypress: ❌
- Cypress Dashboard: ❌
Integrations Summary
| Feature | Cypress Dashboard | Sorry Cypress | Currents |
|---|---|---|---|
| GitHub | ✅ | ✅ | ✅ |
| GitHub Enterprise | ✅ 💼 | ✅ | ✅ |
| GitLab | ✅ | ❌ | ✅ |
| GitLab Self Hosted | ✅ 💼 | ❌ | ✅ |
| BitBucket | ✅ | ✅ | ✅ |
| BitBucket Enterprise | ❔ | ✅ | ✅ |
| MS Teams | ❌ | ✅ | ✅ |
| Slack | ✅ | ✅ | ✅ |
| Jira | ✅ | ❌ | ❌ |
| HTTP Webhooks | ❌ | ✅ | ✅ |
| REST API | ❌ | ❌ | ✅ |
💼 - Business Plan only, starting $300/month
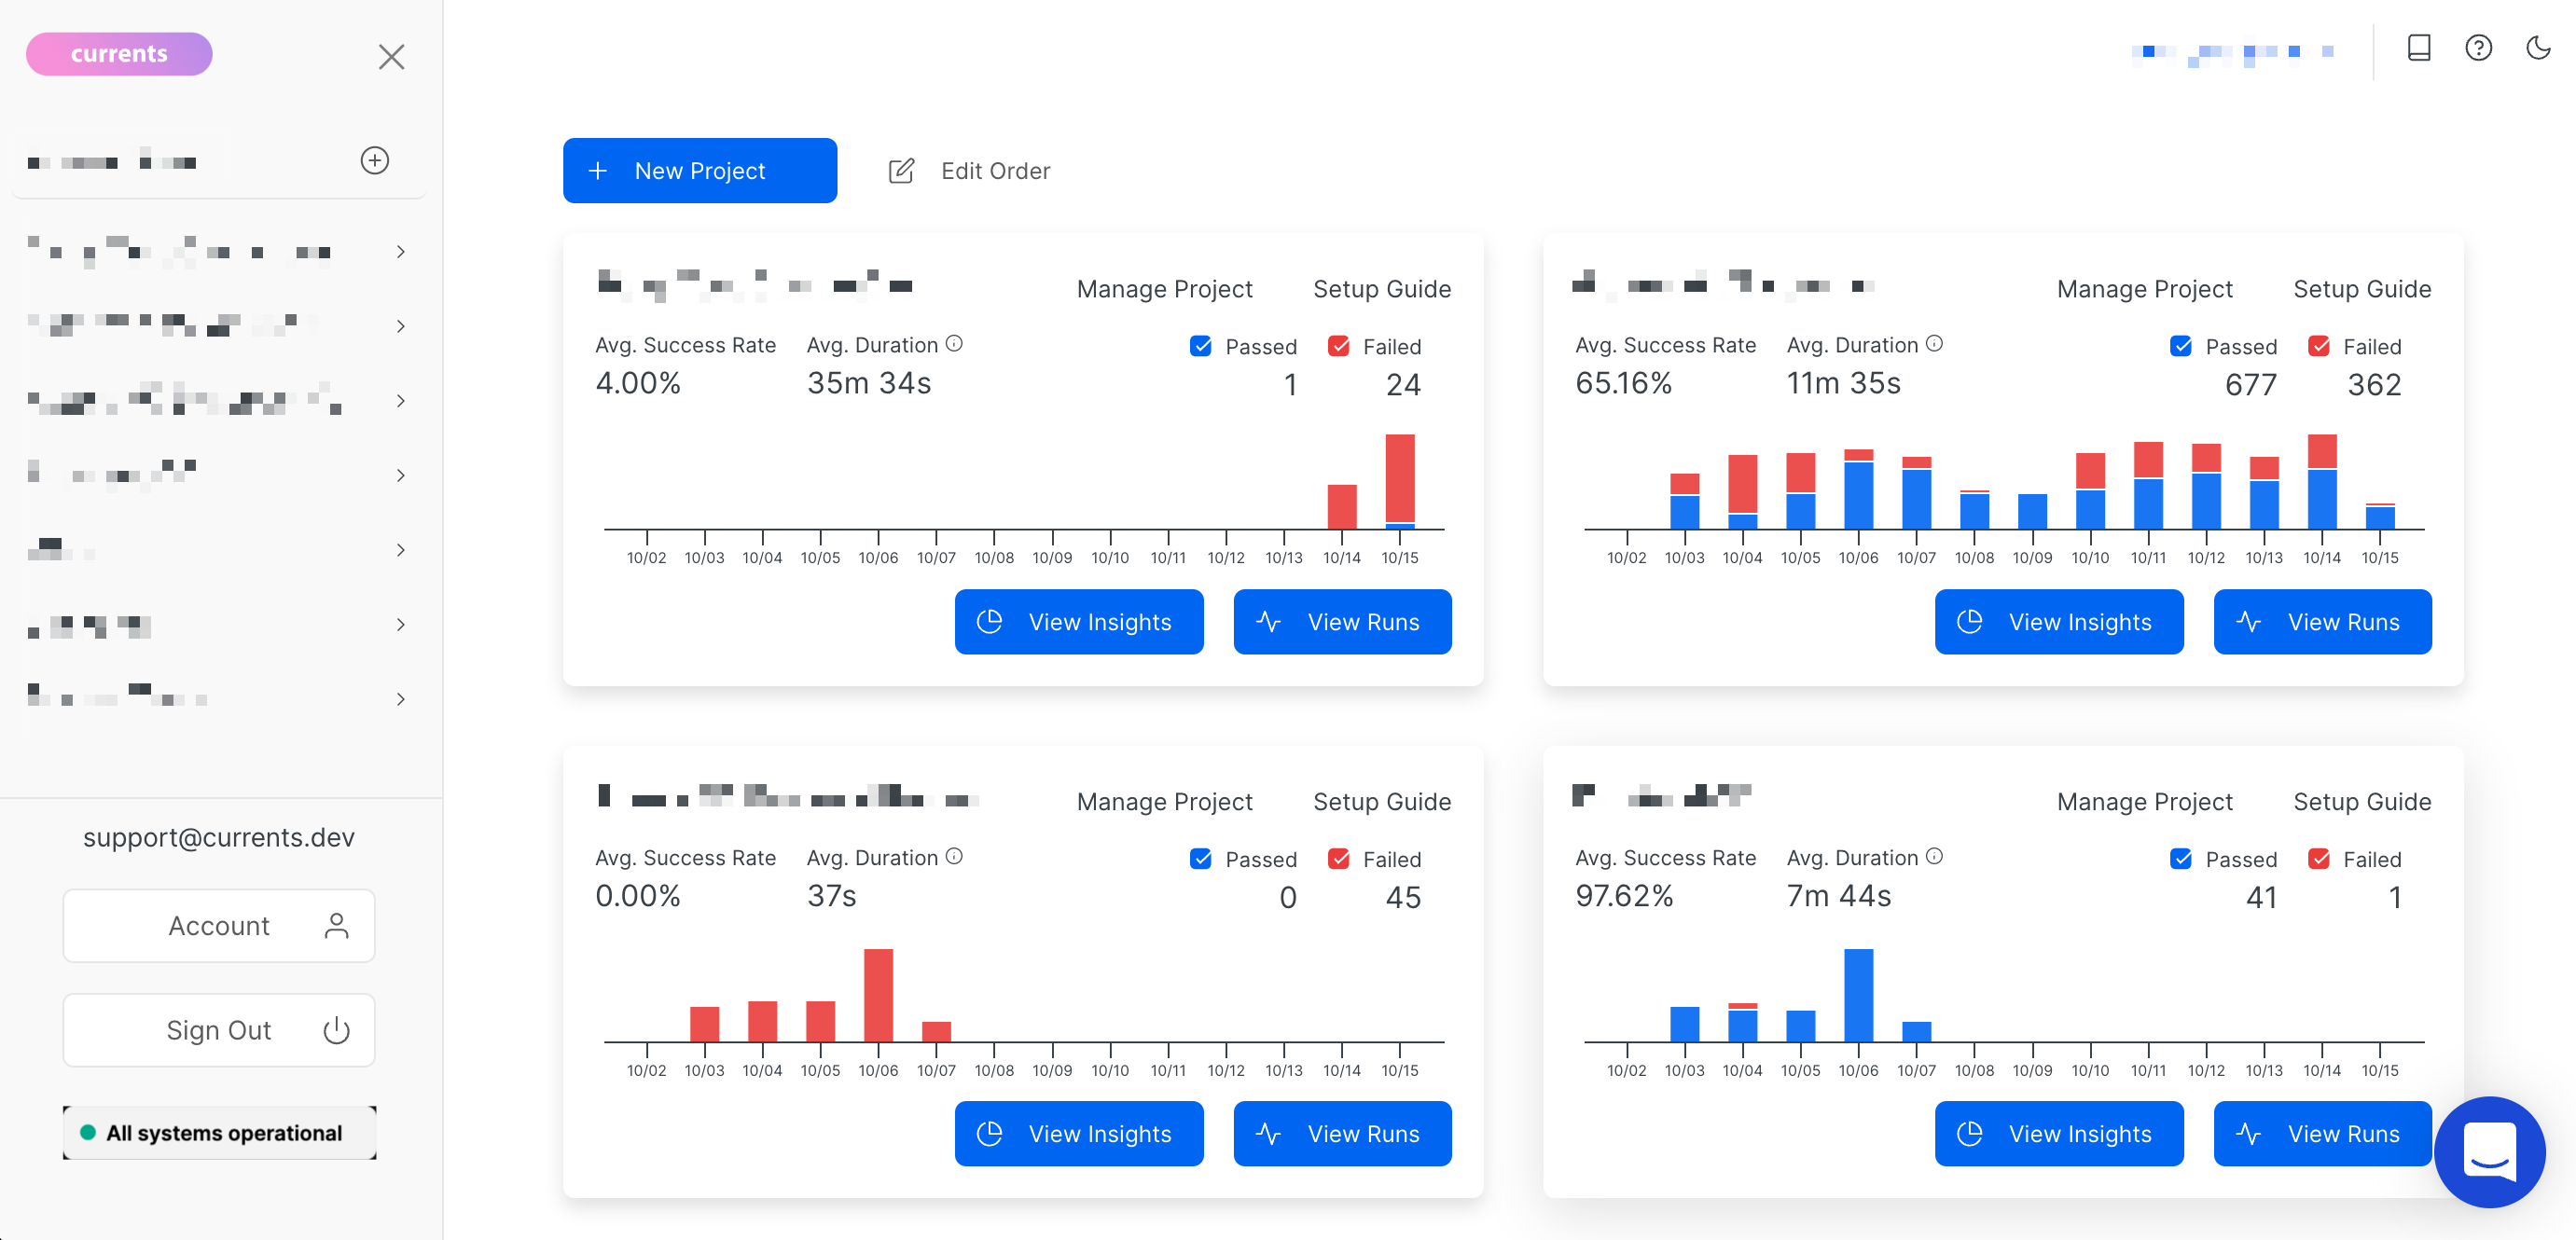
Analytics and reporting
Having macro-level aggregated insights can help you to use your CI resources more efficiently, identify problematic tests to focus the team's efforts, and detect changes in test suites' health trends like duration, failure, or flakiness rate.
For example, you can find answers to the following questions:
- What are the top failing tests in the suite?
- Have the flakiness rate change in the last two weeks?
- Show me the flakiest tests from the last 30 days for the main branch?
- What is the average run duration? How did it change during the last 3 months?
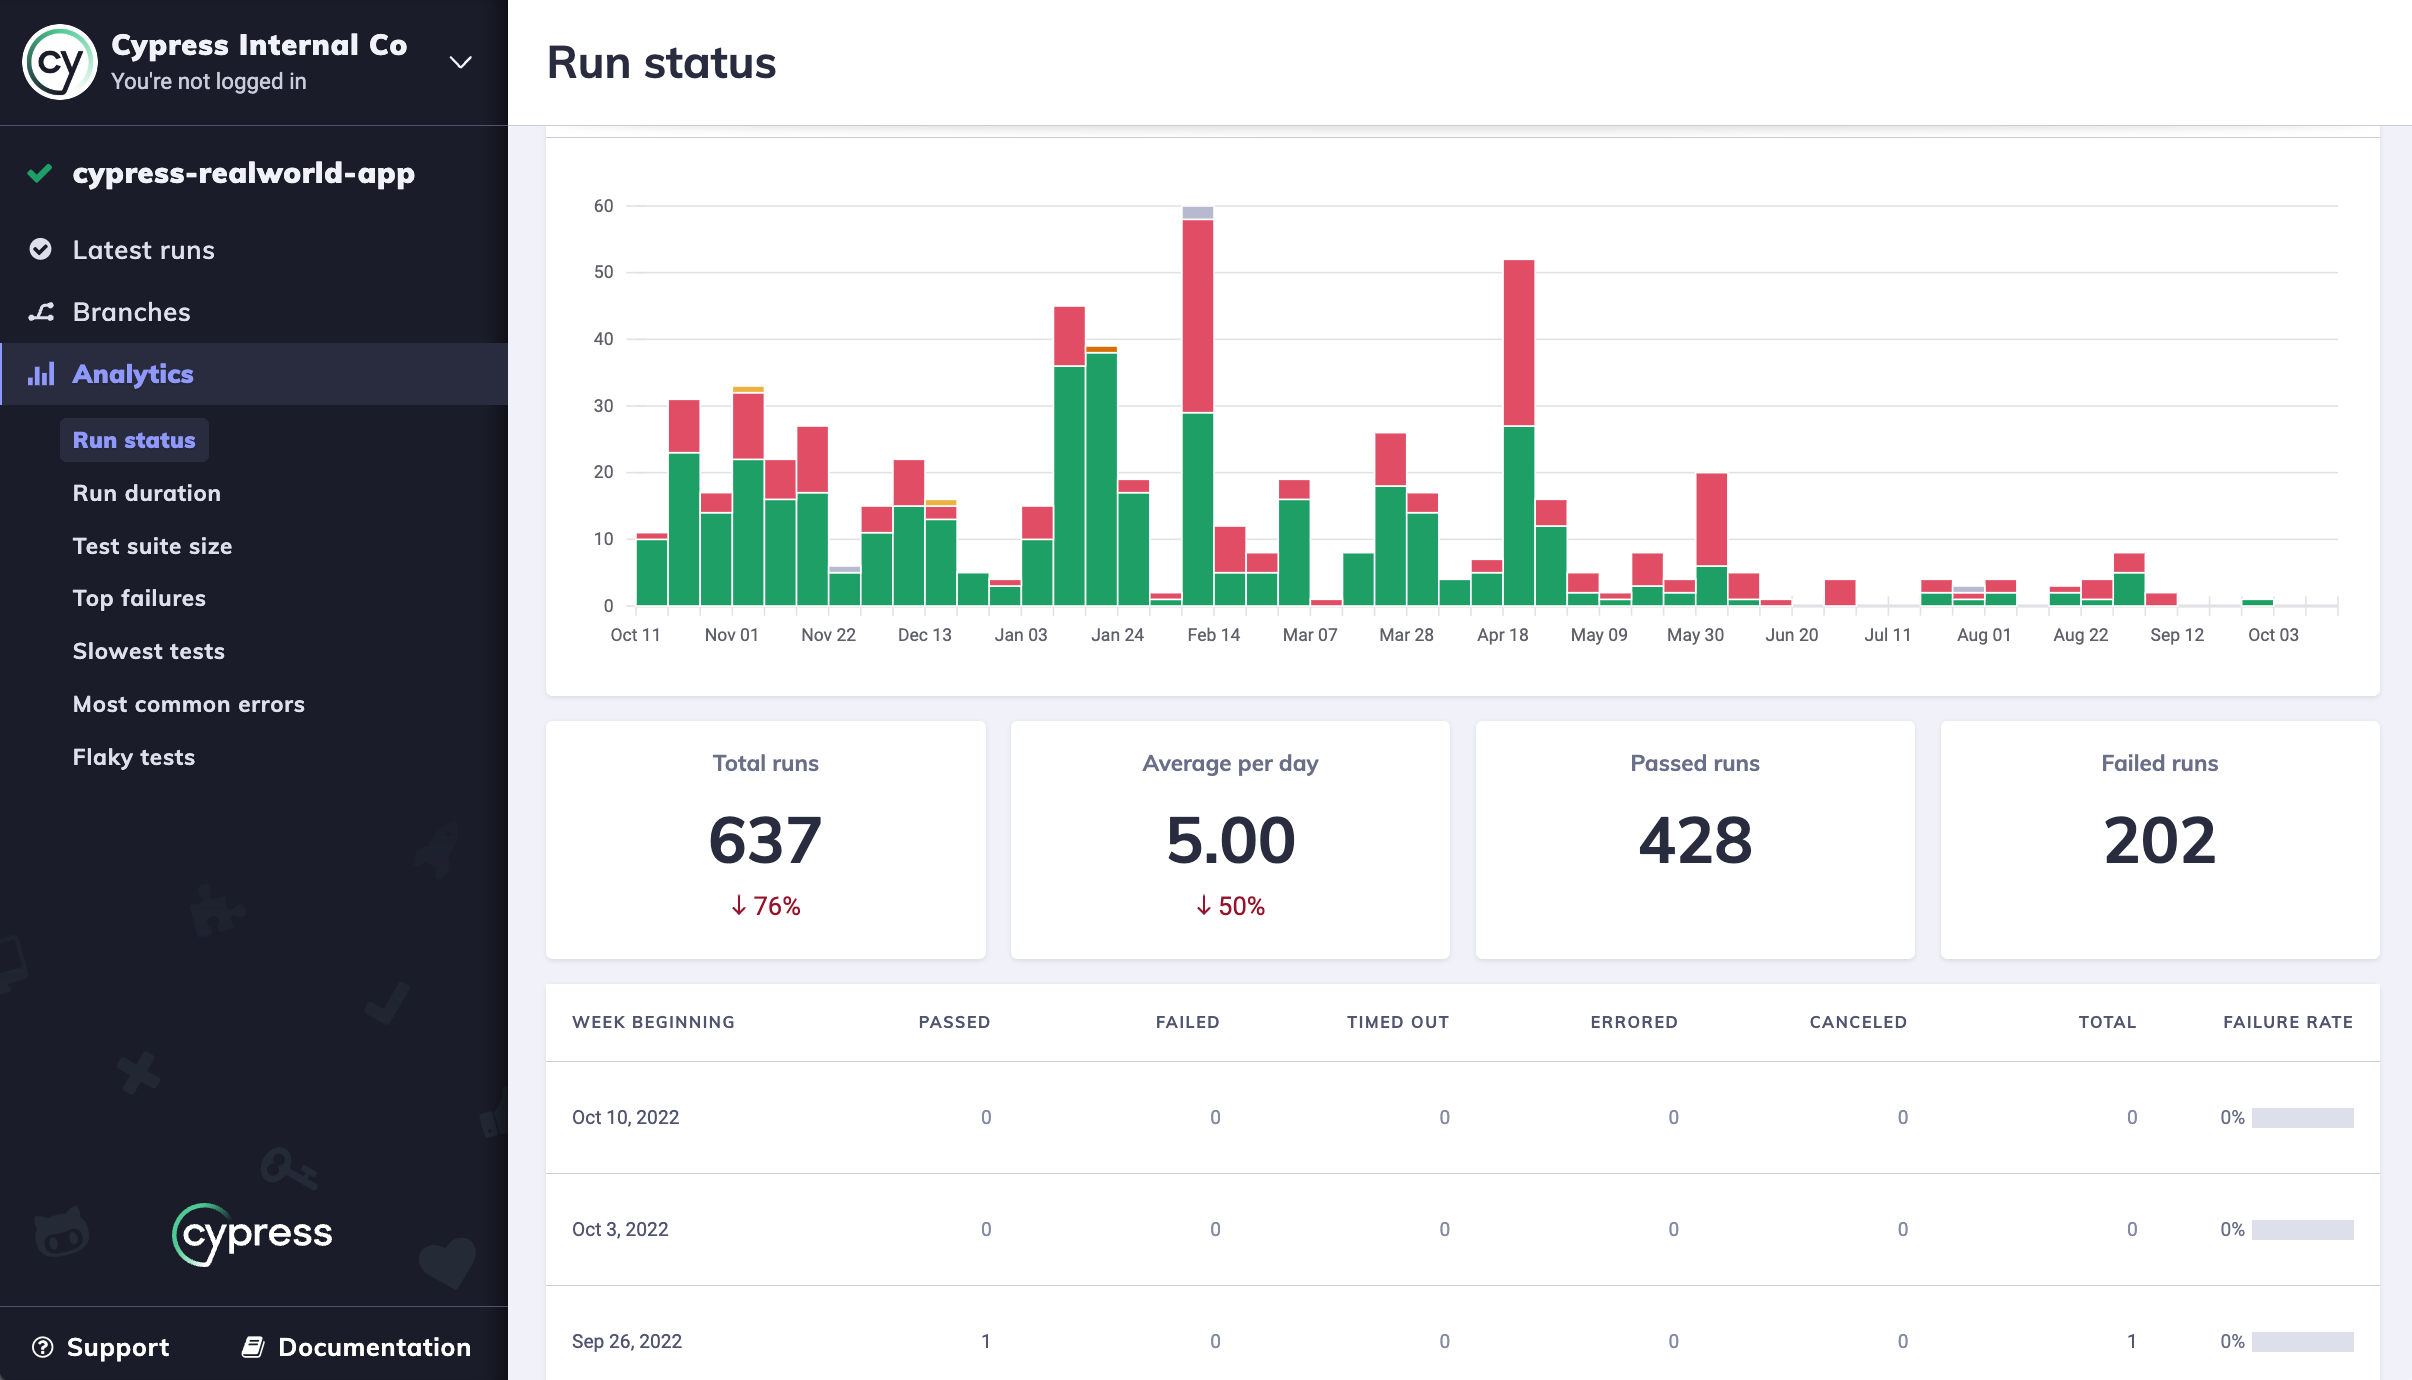
When it comes to Analytics and Reporting, Sorry Cypress does not have any of the analytics and reporting features, but Cypress Dashboard and Currents have some interesting analytics and reporting capabilities.
Comparing between two - Cypress Dashboard provides more filtering options (e.g. filter by cypress runner version), while Current provides explicit and easy-to-use tools for exploring the insights (e.g. flakiest tests, top failing tests, runs duration etc.)
| Feature | Cypress Dashboard | Sorry Cypress | Currents |
|---|---|---|---|
| Run Status | ✅ | ❌ | ✅ |
| Run Duration | ✅ | ❌ | ✅ |
| Top Failures | ✅ | ❌ | ✅ |
| Test Suit Size | ✅ | ❌ | ✅ |
| Common Errors | ✅ | ❌ | ❌ |
| Runs Completion | ❌ | ❌ | ✅ |
| Test Status | ❌ | ❌ | ✅ |
| Slowest Test Explorer | ✅ | ❌ | ✅ |
| Flakiest Test Explorer | ✅ | ❌ | ✅ |
| Top Failing Tests Explorer | ✅ | ❌ | ✅ |
| Slowest Specs Explorer | ✅ | ❌ | ✅ |
| Unstable Spec Explorer | ❌ | ❌ | ✅ |
| Flakiest Specs Explorer | ✅ | ❌ | ✅ |
| Spec Files Execution History | ❌ | ❌ | ✅ |
| Tests Execution History | ❌ | ❌ | ✅ |
| Filter Options | 3-11 filter options | n/a | 5 filter options |
Pricing: Cypress Dashboard vs. Sorry Cypress vs. Currents
Sorry Cypress Pricing
The Sorry Cypress is free software that allows unlimited parallelization, recording, and debugging. The associated costs are:
- Cloud infrastructure costs (varies based on usage/provider)
- Maintenance and support cost
Cypress Dashboard Pricing
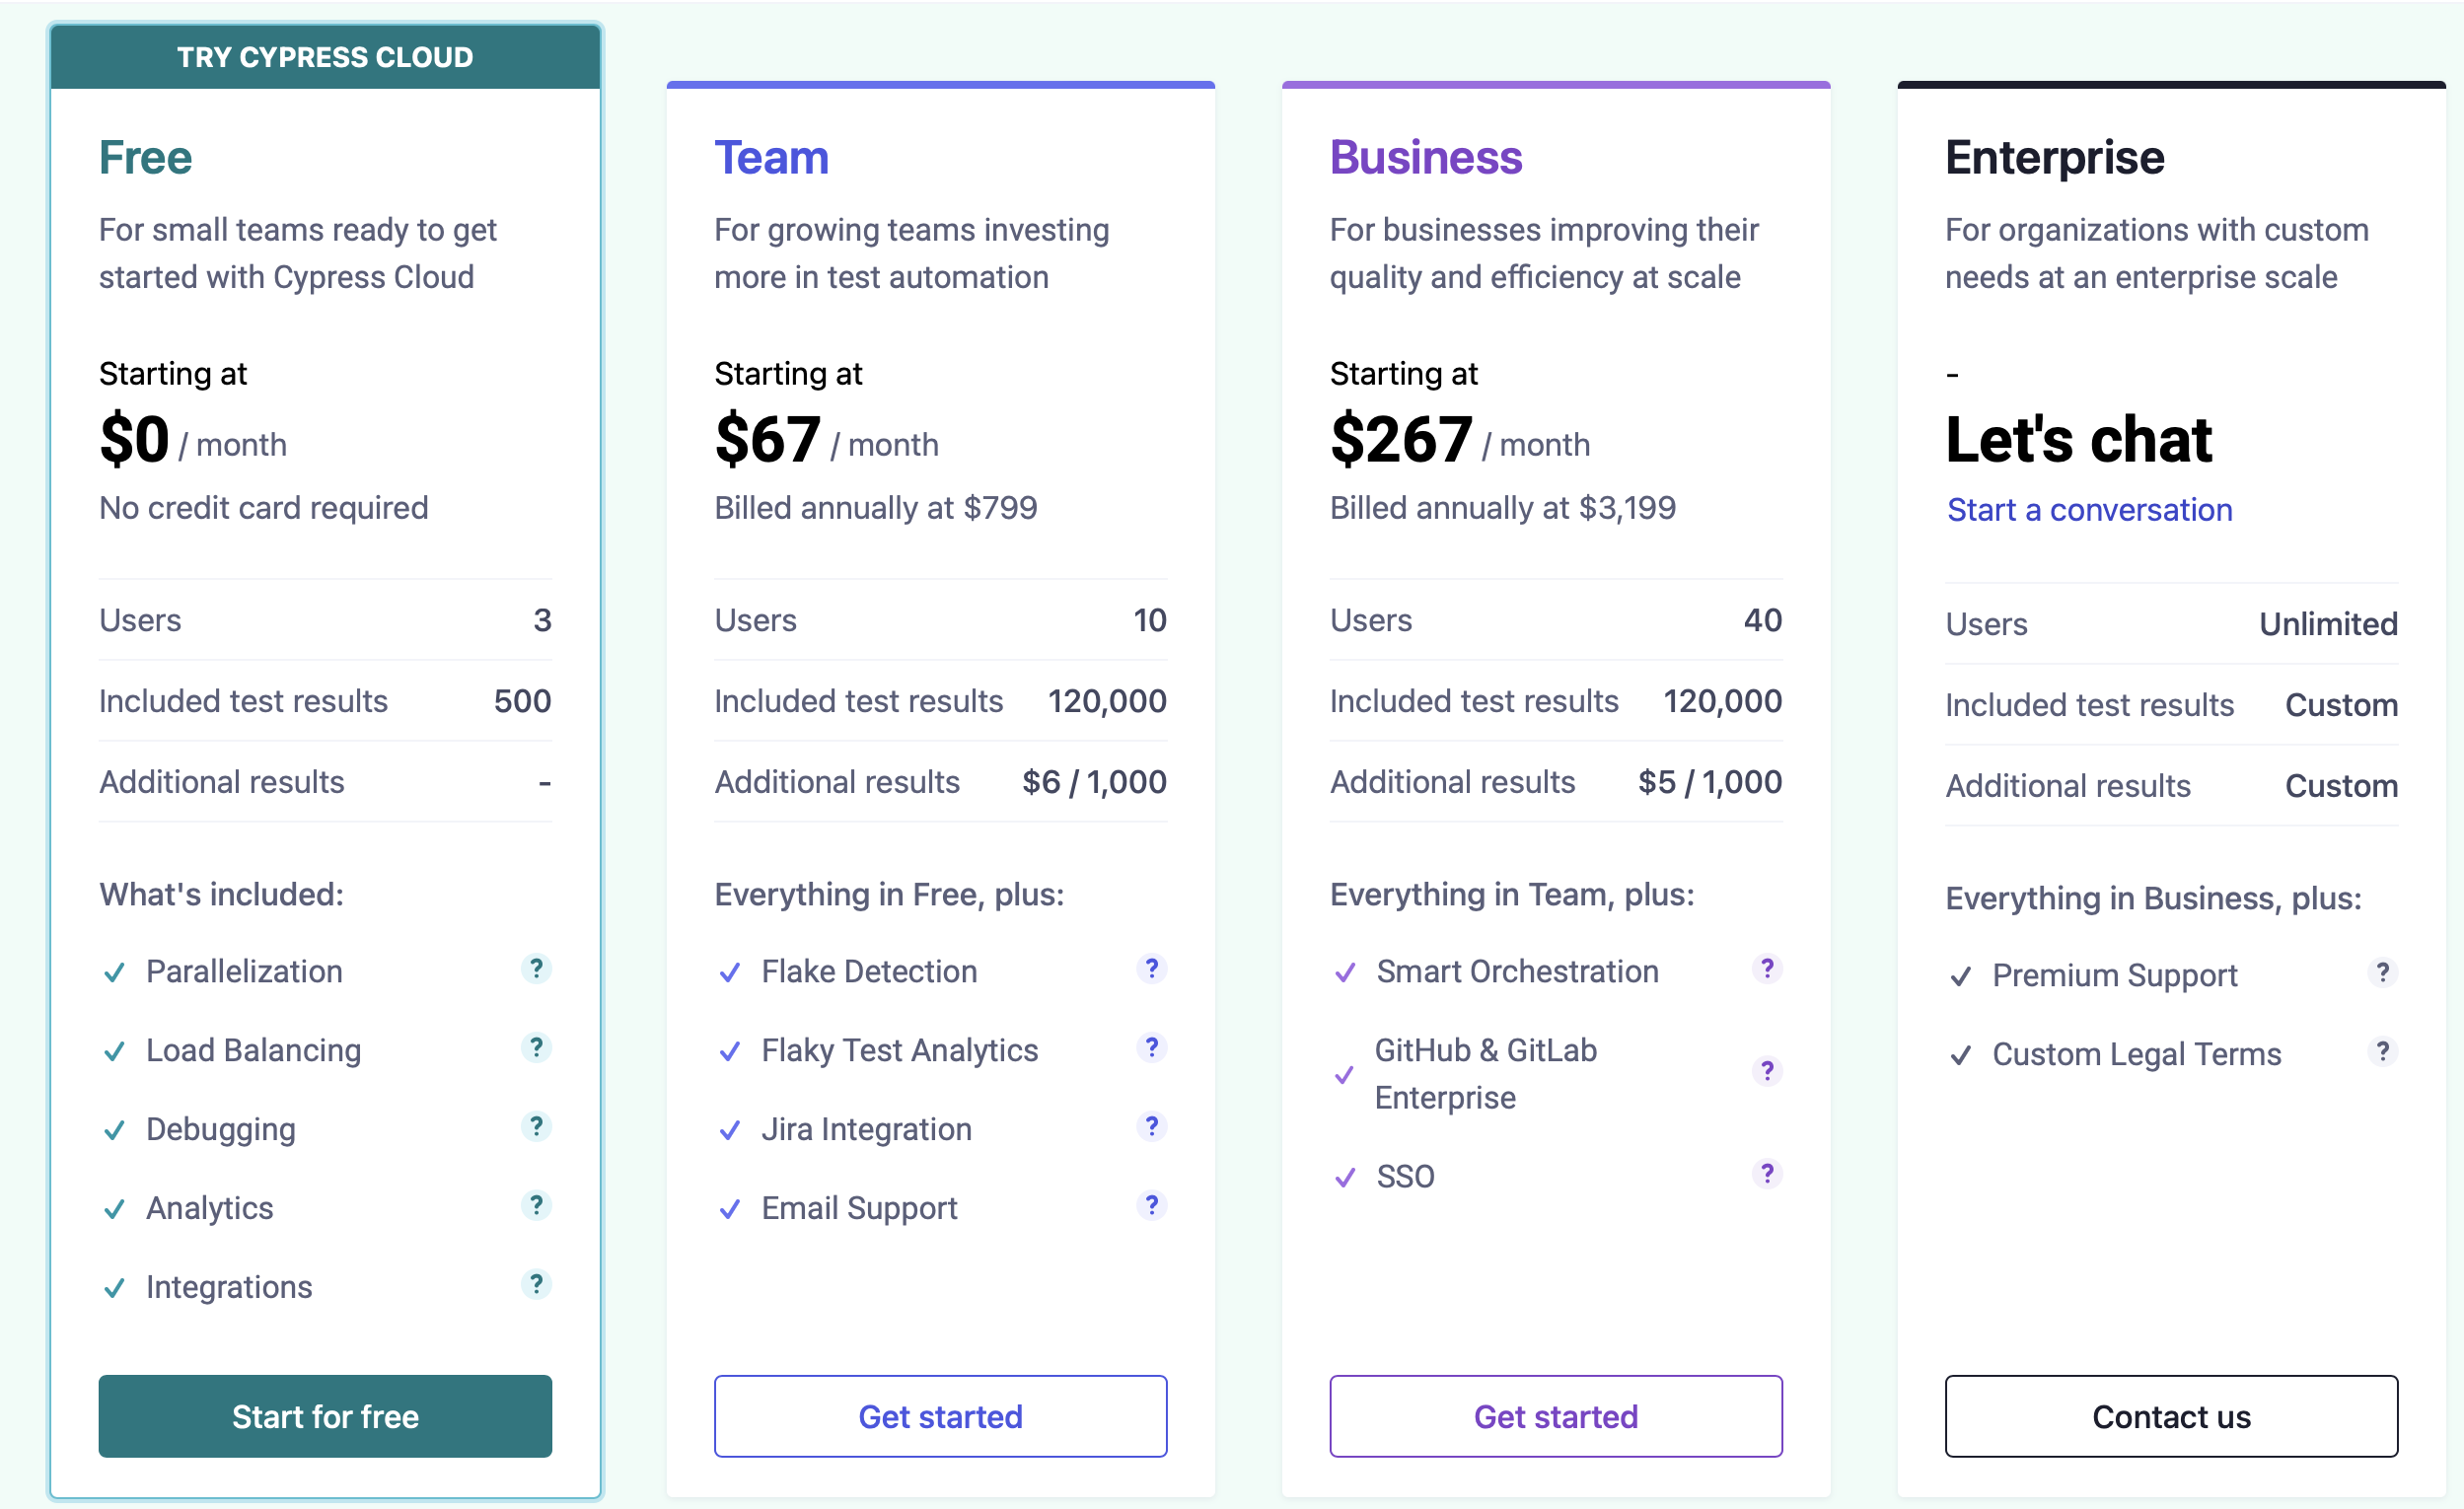
The Cypress Dashboard has 4 tiers that vary by available features and the number of users. Within those plans, the actual monthly charge depends on the number of tests recorded during a month.
| Feature | Free | Team | Business | Enterprise |
|---|---|---|---|---|
| Parallelization | ✅ | ✅ | ✅ | ✅ |
| Load Balancing | ✅ | ✅ | ✅ | ✅ |
| Debugging | ✅ | ✅ | ✅ | ✅ |
| Analytics | ✅ | ✅ | ✅ | ✅ |
| Flake Management | ❌ | ✅ | ✅ | ✅ |
| SSO | ❌ | ❌ | ✅ | ✅ |
| Smart Orchestration | ❌ | ❌ | ✅ | ✅ |
| Integrations | GitHub, GitLab, Slack, BitBucket | +Jira | +Enterprise | ✅ |
| Support | Community | Premium | ||
| Users | 3 | 10 | 40 | unlimited |
| Max Tests Records | 500 | 300K | 300K | unlimited |
| Entry Price | free | $US75 | $US300 | custom |
Free Plan
Its free plan provides access to limited features, only 3 members, and a limit of 500 test records per month.
Team Plan
The Teams plan starts at $75 per month, designed to use with a small number of users. You can invite up to ten users.
Business Plan
The business plan costs starting $300 per month and allows up to 40 users. Apart from everything included in the Teams plan, the Business plan includes the following features.
- Smart Orchestration (Run failed specs first, Cancel run on failure)
- GitHub Enterprise
- GitLab for Enterprise
- SSO
- Email Support
Enterprise Plan
If you want the Cypress Dashboard unlimited number of users and more than 300K monthly test results, you will need to switch to an enterprise plan. It includes every feature from the business plan plus:
- Unlimited test records
- Unlimited users
- Premium support
Currents Pricing
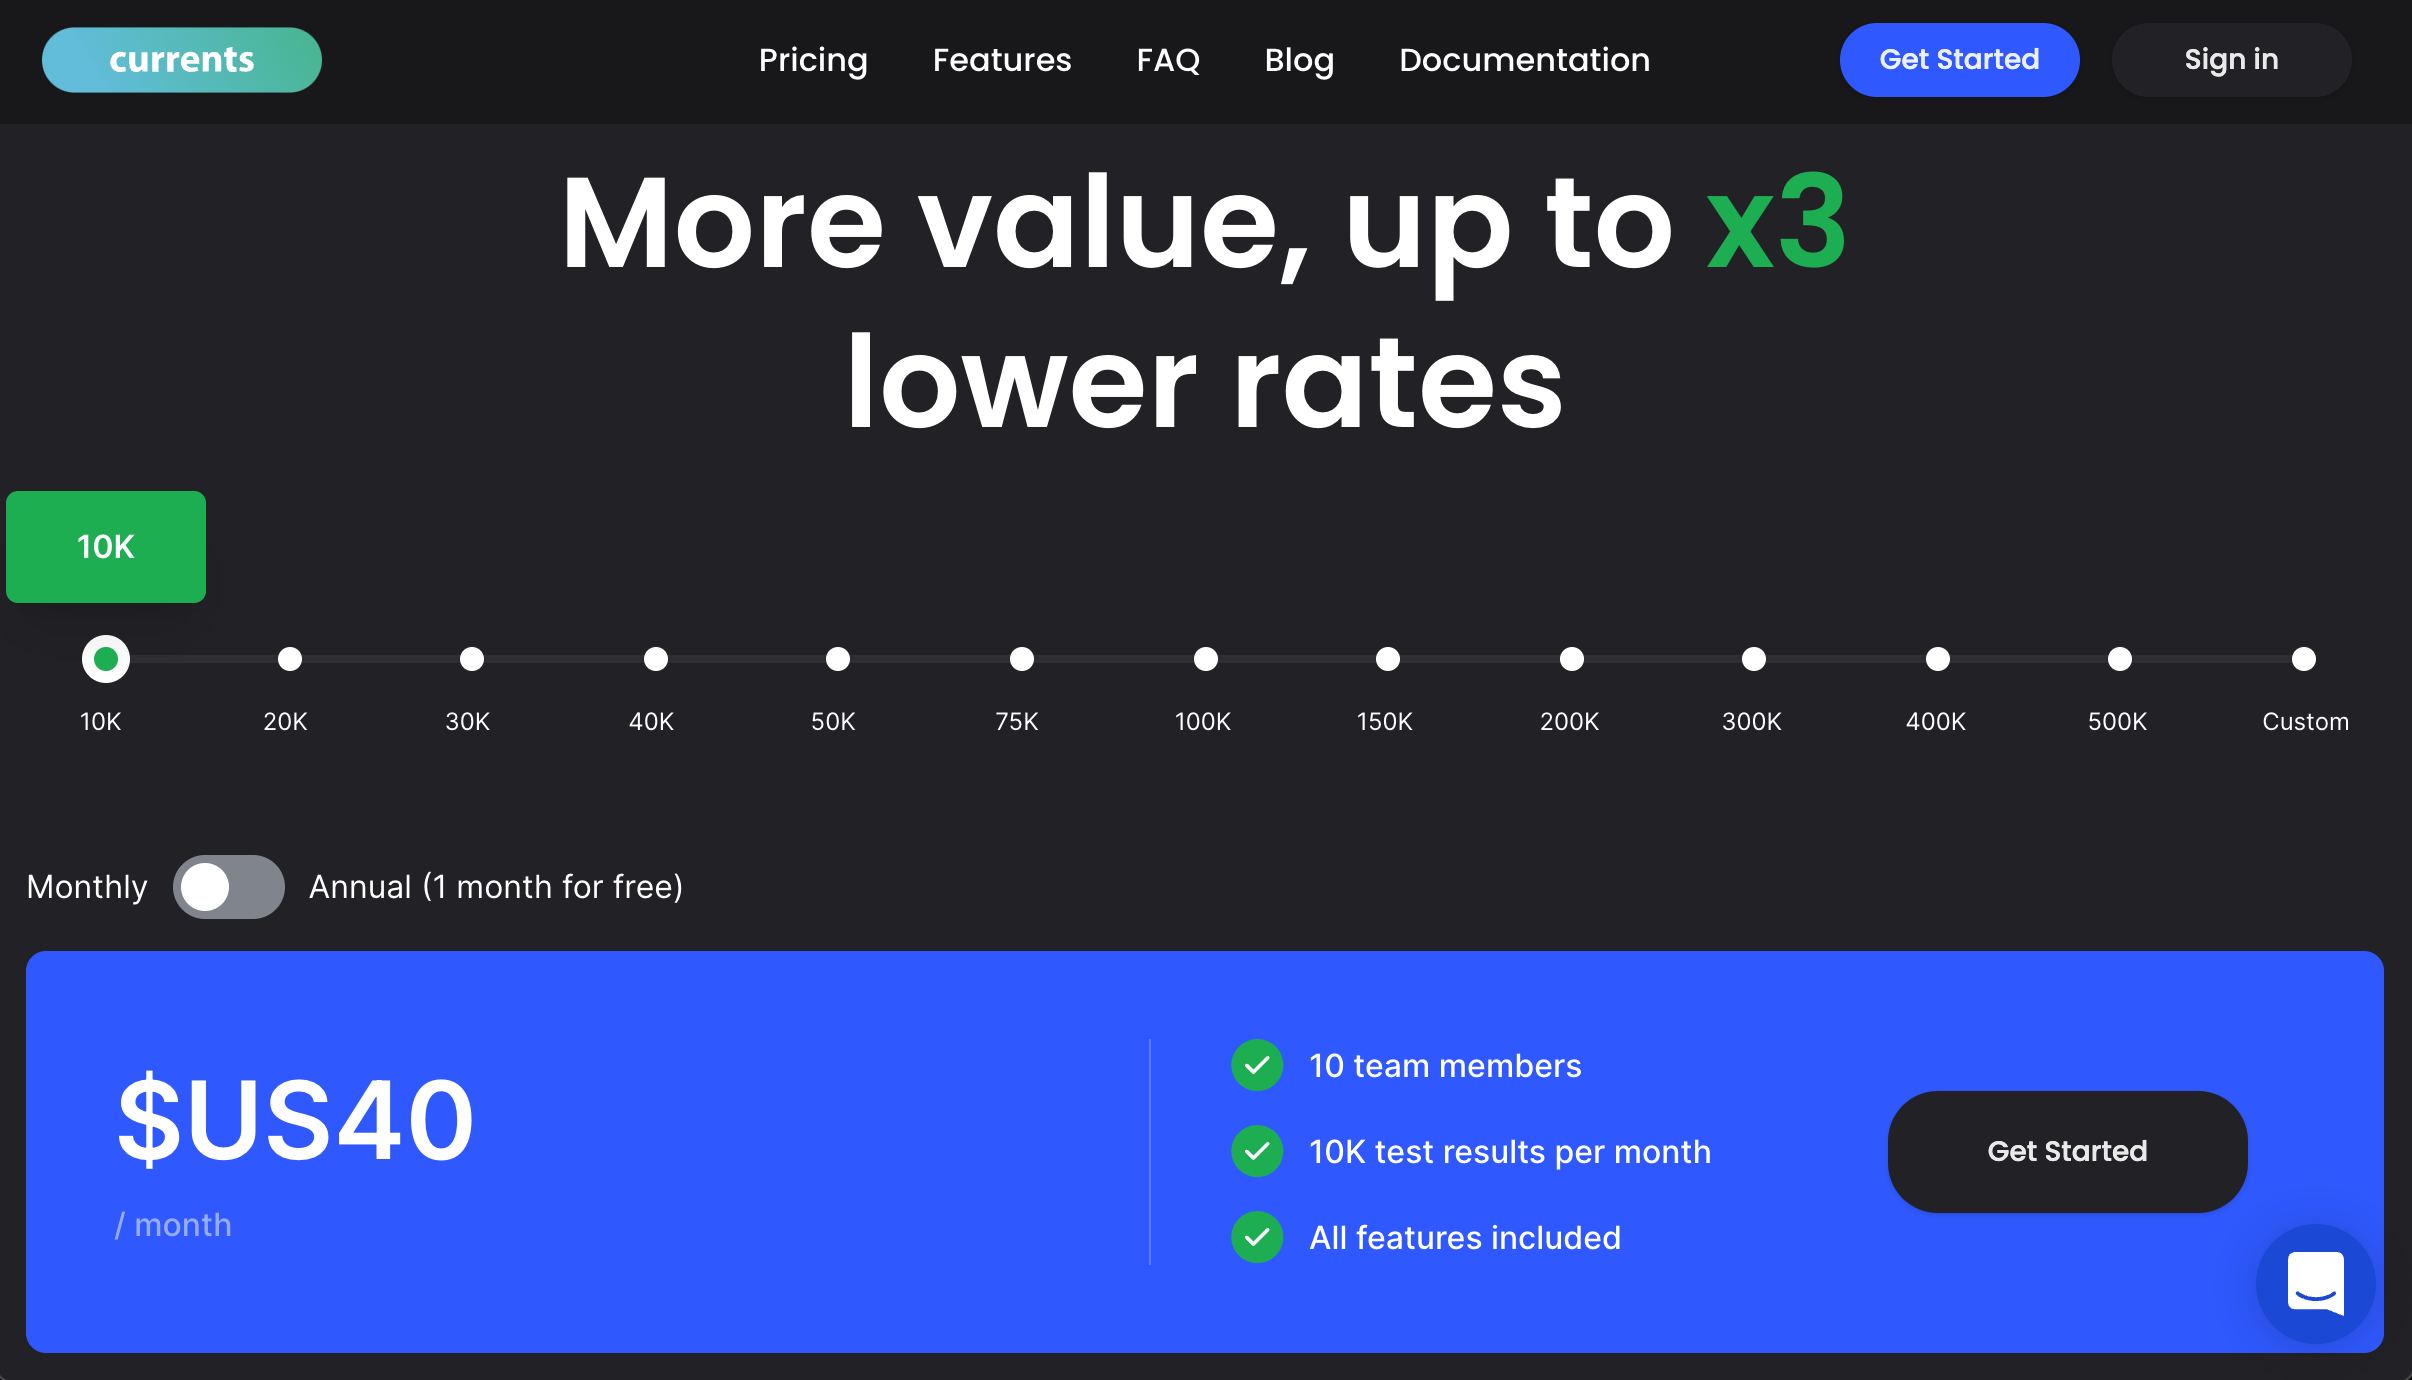
Currents has a flexible pricing structure - the plans are based on the number of test results per month and the team size. Its plans start at $40 per month that provides up to 10K test results and access to up to 10 team members.
These various plans match organizations with different test volumes and number of team members. Also, the price is up to 86% lower compared to Cypress Dashboard.
All plans include all of the Currents’ features.
Unit Economics of Cypress Tests
Let's compare the pricing plans between the two paid solutions: Cypress Dashboard and Currents. We'll scale down to the resolution of 1K test recordings and compare between different plans and volumes.
Comparing Cypress Teams Plan Pricing with Currents
| Tests Volume | Cypress Dashboard - 🙌 Team Plan ($/1K tests) | Currents ($/1K tests) | Difference |
|---|---|---|---|
| 10K | $75 ($7.50) | $40 ($4.00) | 46.67% |
| 20K | $135 ($6.75) | $75 ($3.80) | 44.44% |
| 30K | $195 ($6.50) | $105 ($3.62) | 46.15% |
| 40K | $255 ($6.38) | $135 ($3.375) | 47.06% |
| 50K | $315 ($6.30) | $165 ($3.30) | 47.62% |
| 75K | $465 ($6.20) | $240 ($3.20) | 48.39% |
| 100K | $615 ($6.15) | $300 ($3.00) | 51.22% |
| 150K | $915 ($6.10) | $420 ($2.80) | 54.10% |
| 200K | $1,215 ($6.075) | $540 ($2.70) | 55.56% |
| 300K | $1,815 ($6.05) | $760 ($2.34) | 58.13% |
Comparing Cypress Business Plan Pricing with Currents
| Tests Volume | Cypress Dashboard - 💼 Business Plan ($/1K tests) | Currents ($/1K tests) | Difference |
|---|---|---|---|
| 10K | $300 ($30.00) | $40 ($4.00) | 86.67% |
| 20K | $350 ($17.50) | $75 ($3.80) | 78.57% |
| 30K | $400 ($13.33) | $105 ($3.62) | 73.75% |
| 40K | $450 ($11.25) | $135 ($3.375) | 70.00% |
| 50K | $500 ($10.00) | $165 ($3.30) | 67.00% |
| 75K | $625 ($8.33) | $240 ($3.20) | 61.60% |
| 100K | $750 ($7.50) | $300 ($3.00) | 60.00% |
| 150K | $1,000 ($6.67) | $420 ($2.80) | 58.00% |
| 200K | $1,250 ($6.25) | $540 ($2.70) | 56.80% |
| 300K | $1,750 ($5.83) | $760 ($2.34) | 56.57% |
To summarize:
- Currents is on average 49.93% (almost x2) cheaper comparing to Cypress Team plan
- Currents is on average 66.9% (more than twice) cheaper compared to Cypress Business plan
Cypress Dashboard Business plan is priced relatively high ($10-$30 / 1K tests) for lower (up to 50K) volumes. It is clear that the Business plan is built for customers with a higher amount of tests, also the Business plan unlocks access to all the tools.
Currents includes all the features even at the lowest cost option.
Sorry Cypress is the cheapest option and the only associated costs are maintenance and infrastructure, it was not included in the pricing comparison.
CI Providers, Compatibility, and Support
All 3 dashboards are fully compatible with cypress and allow running cypress tests in parallel on popular CI providers like:
- CircleCI
- GitHub Actions
- GitLab CI
- AWS CodeBuild
- Azure Pipelines
- and many more
There's a little effort required to start using cypress with Sorry Cypress and Currents - both services provide lightweight npm packages that enable seamless integration with cypress runners without affecting its functionality.
While all 3 tools work smoothly in CI headless mode (via cypress run ...), only Cypress Dashboard has native integration with Cypress runner interactive UI. Currents and Sorry Cypress are not integrated with the interactive UI, and do not provide the same native experience compared to Cypress Dashboard.
| Feature | Cypress Dashboard | Sorry Cypress | Currents |
|---|---|---|---|
| CircleCI | ✅ | ✅ | ✅ |
| GitHub Actions | ✅ | ✅ | ✅ |
| GitLab CI | ✅ | ✅ | ✅ |
| Jenkins | ✅ | ✅ | ✅ |
| AWS CodeBuild | ✅ | ✅ | ✅ |
| Azure Pipelines | ✅ | ✅ | ✅ |
| Compatibility | built-in | cypress-cloud | cypress-cloud |
| Operation Mode | Interactive, CI | CI | CI |
| Support | Community | In-app chat / Email |
Conclusion
Currents, Cypress Dashboard, and Sorry Cypress are alternative solutions for scaling up and managing end-to-end Cypress tests suite. We've compared the products in terms of parallelization and orchestration, debugging and troubleshooting, analytics and reporting, environmental and build information, integrations, and pricing.
Sorry Cypress is a self-hosted solution, that is also the cheapest, but is limited in features and requires an experienced team of DevOps professionals to maintain.
Currents has 95%+ parity compared to Cypress Dashboard, is easy to set up, and is 100% compatible with cypress runner. It provides a few additional tools that are not present in the original Cypress Dashboard like REST API, HTTP Webhooks, enhanced analytics, and reporting. Currents pricing is x2-x2.5 lower compared to Cypress Dashboard - all users have access to all the features, regardless of the selected plan.
Moreover, Currents also supports Playwright framework, allowing your teams to use both tools simultaneously or migrate one to another while keep reporting the results to the same tool.
Cypress Dashboard is the original, mainstream, and well-known service that natively integrates with the open-source cypress runner and is being widely used. Customers will have to pay an extra premium for using the original dashboard and getting access to all the features.
Join hundreds of teams using Currents.
Trademarks and logos mentioned in this text belong to their respective owners.