Playwright Dashboard by Currents
View, Debug and Monitor Playwright Tests
We are thrilled to announce our support for Playwright - the emerging most popular test automation framework for reliable and fast end-to-end testing for modern web apps 🚀.
After helping software teams using Cypress to run their E2E tests at scale, we are launchin Playwright reporter by Currents. Playwright provides developer-friendly API, amazing performance and great releases and updates cadence.
Playwright Report by Currents
🔎 Discover how Currents can enhance your Playwright testing. Here, we will delve into how our reporting tools help to improve test performance, manage test flakiness.

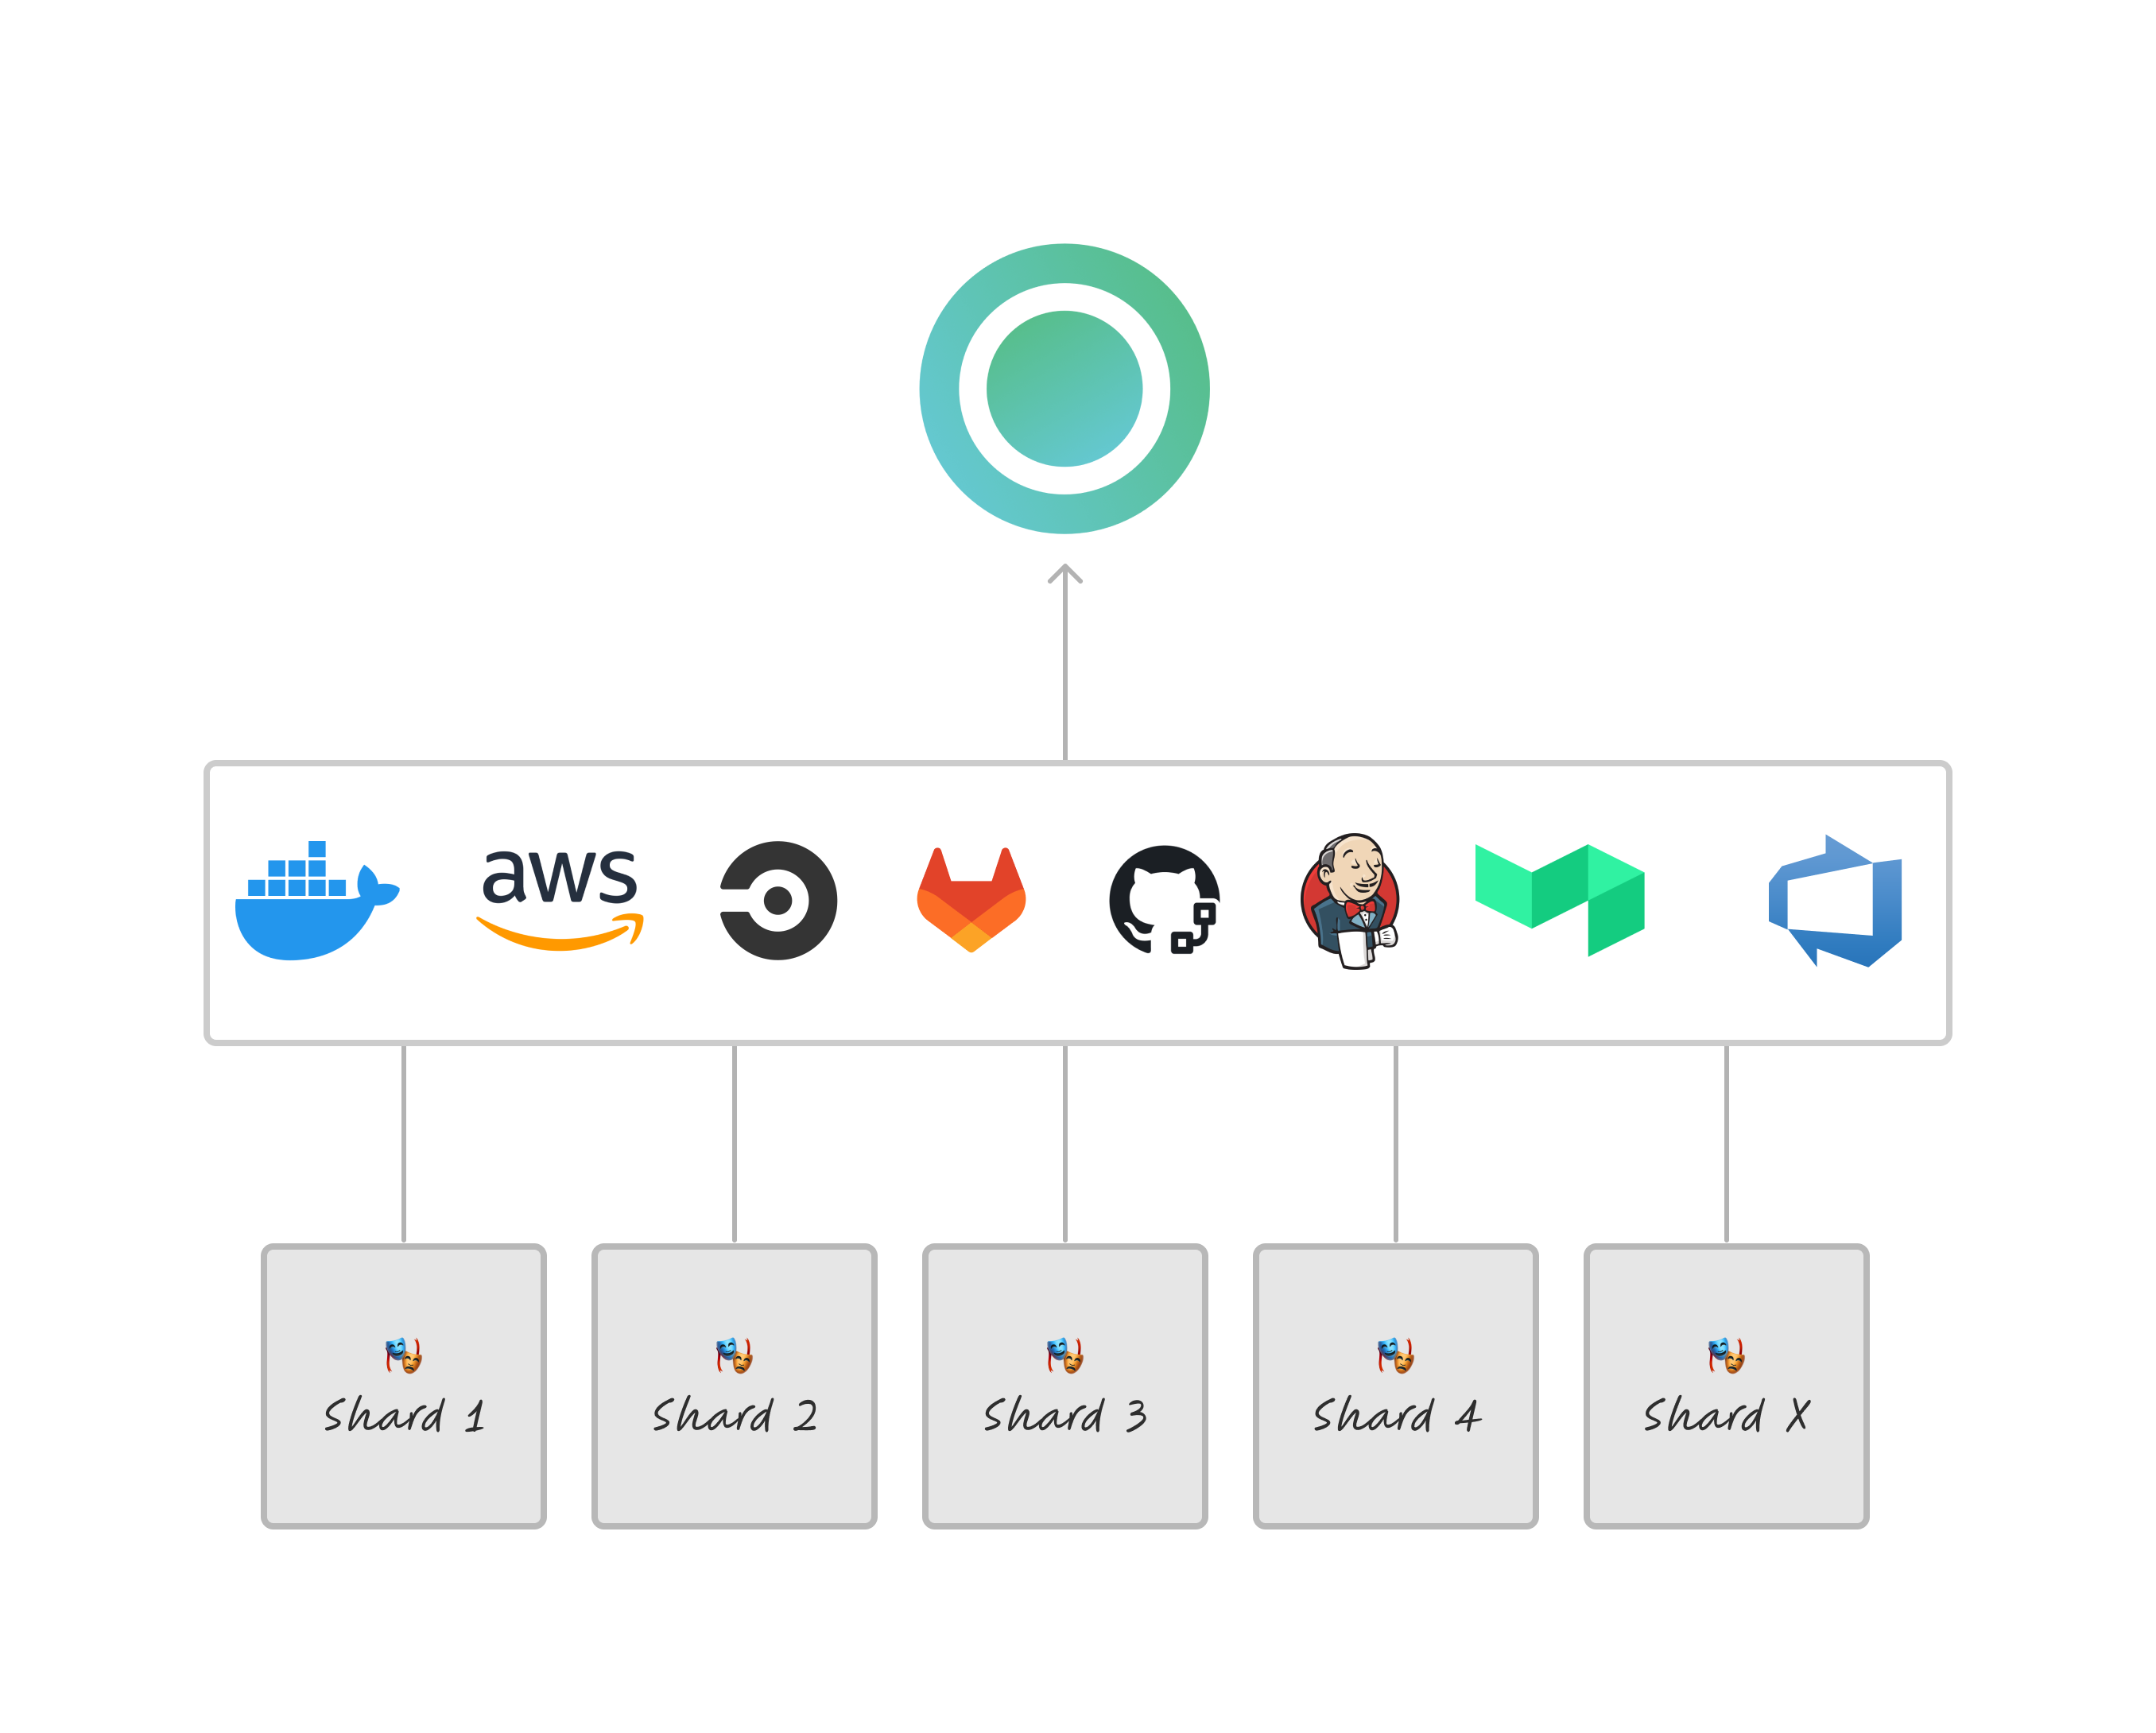
Currents is CI-agnostic, it collects results from distributed Playwright shards, reducing troubleshooting time of failed and flaky tests with access to Playwright Traces, screenshots and videos and providing actionable insights into your test suite performance beyond an individual run.

👋 Book a discovery call or 👉🏻 Create an account to explore more.
E2E Tests in a Company
As a developer or QA professional 🥷 - you are well familiar with the frustration of a failed CI test - even with Playwright reporters configured, it's cumbersome to navigate the CI provider interface to find the right traces, screenshots, logs and videos. If you're using sharded parallel runs, collecting failures across different machines is quite an annoying procedure.
After fixing a failed test and restarting the CI pipeline, another set of tests is failing! The CI pipeline is red... and another restart didn't help!
Is it a flaky test or a real failure? Is the test failing on other branches? When was the last time the test failed? What is the most common error for this test?
Wouldn't it be great to go back in time and see the previous runs of this test... but only for main branch and only tagged staging...
As a team lead you want to popularize the culture of writing and fixing tests among your dev team, how could you do that? A good idea is to make it easier to show the results right where the devs are hanging out - Slack, GitHub (GitLab) PRs, or have a webhook that opens a ticket when a certain failure occurs.
Another problem you have is to reduce your test suite flakiness because your team has been reluctant to write tests - they don't trust them because they are flaky. Where should you start? It woudld be great to start measuring the flakiness, and then you'd focus one the flakiest tests first. Knowing the top errors will make it easy to resolve the flakiness more effectively.
Ideally, you want to automate this routine - something that can find the most problematic tests, e.g.: top failing tests, slowest tests, top flaky tests. Also, if suddenly a test changed its behavior - became flaky or too slow, you just want to get a report and not to dig into the test results.
Later you need to create a few reports to share with your manager - how fast are the E2E tests, are the test suite size and the coverage increasing, and what is the runs' success rate?
As an engineering manager or director 👨💼 you need a high-level test suite performance report for each of your projects, it also would be great to see the trends and how the performance changes with time, so you can set objectives that drive your organization's testing strategy.
Of course, your team can build a test reporting tool in-house. However, such projects usually are underestimated in their complexity, and maintaining them is always the last priority. After all, building test reporting tool is not your company's business - you can use the available resources better.
It would be great to have a service that already has it all... and also fits the budget, is reliable, scales well in terms of test volume, team size, and pricing; has SSO support, connects to your company's data lake, and has responsive, friendly and professional support.
If this situation sounds familiar, you are in the right place - 👋 Book a discovery call or 👉🏻 Create an account to explore more.
Easy Setup and Integration
It takes a few minutes to setup, and you can start collecting and reviewing your Playwright test results right away.
$ npm install --save-dev @currents/playwright
$ npx pwc --key secret --ci-build-id hello-currents
Collecting and Reviewing Playwright Executions
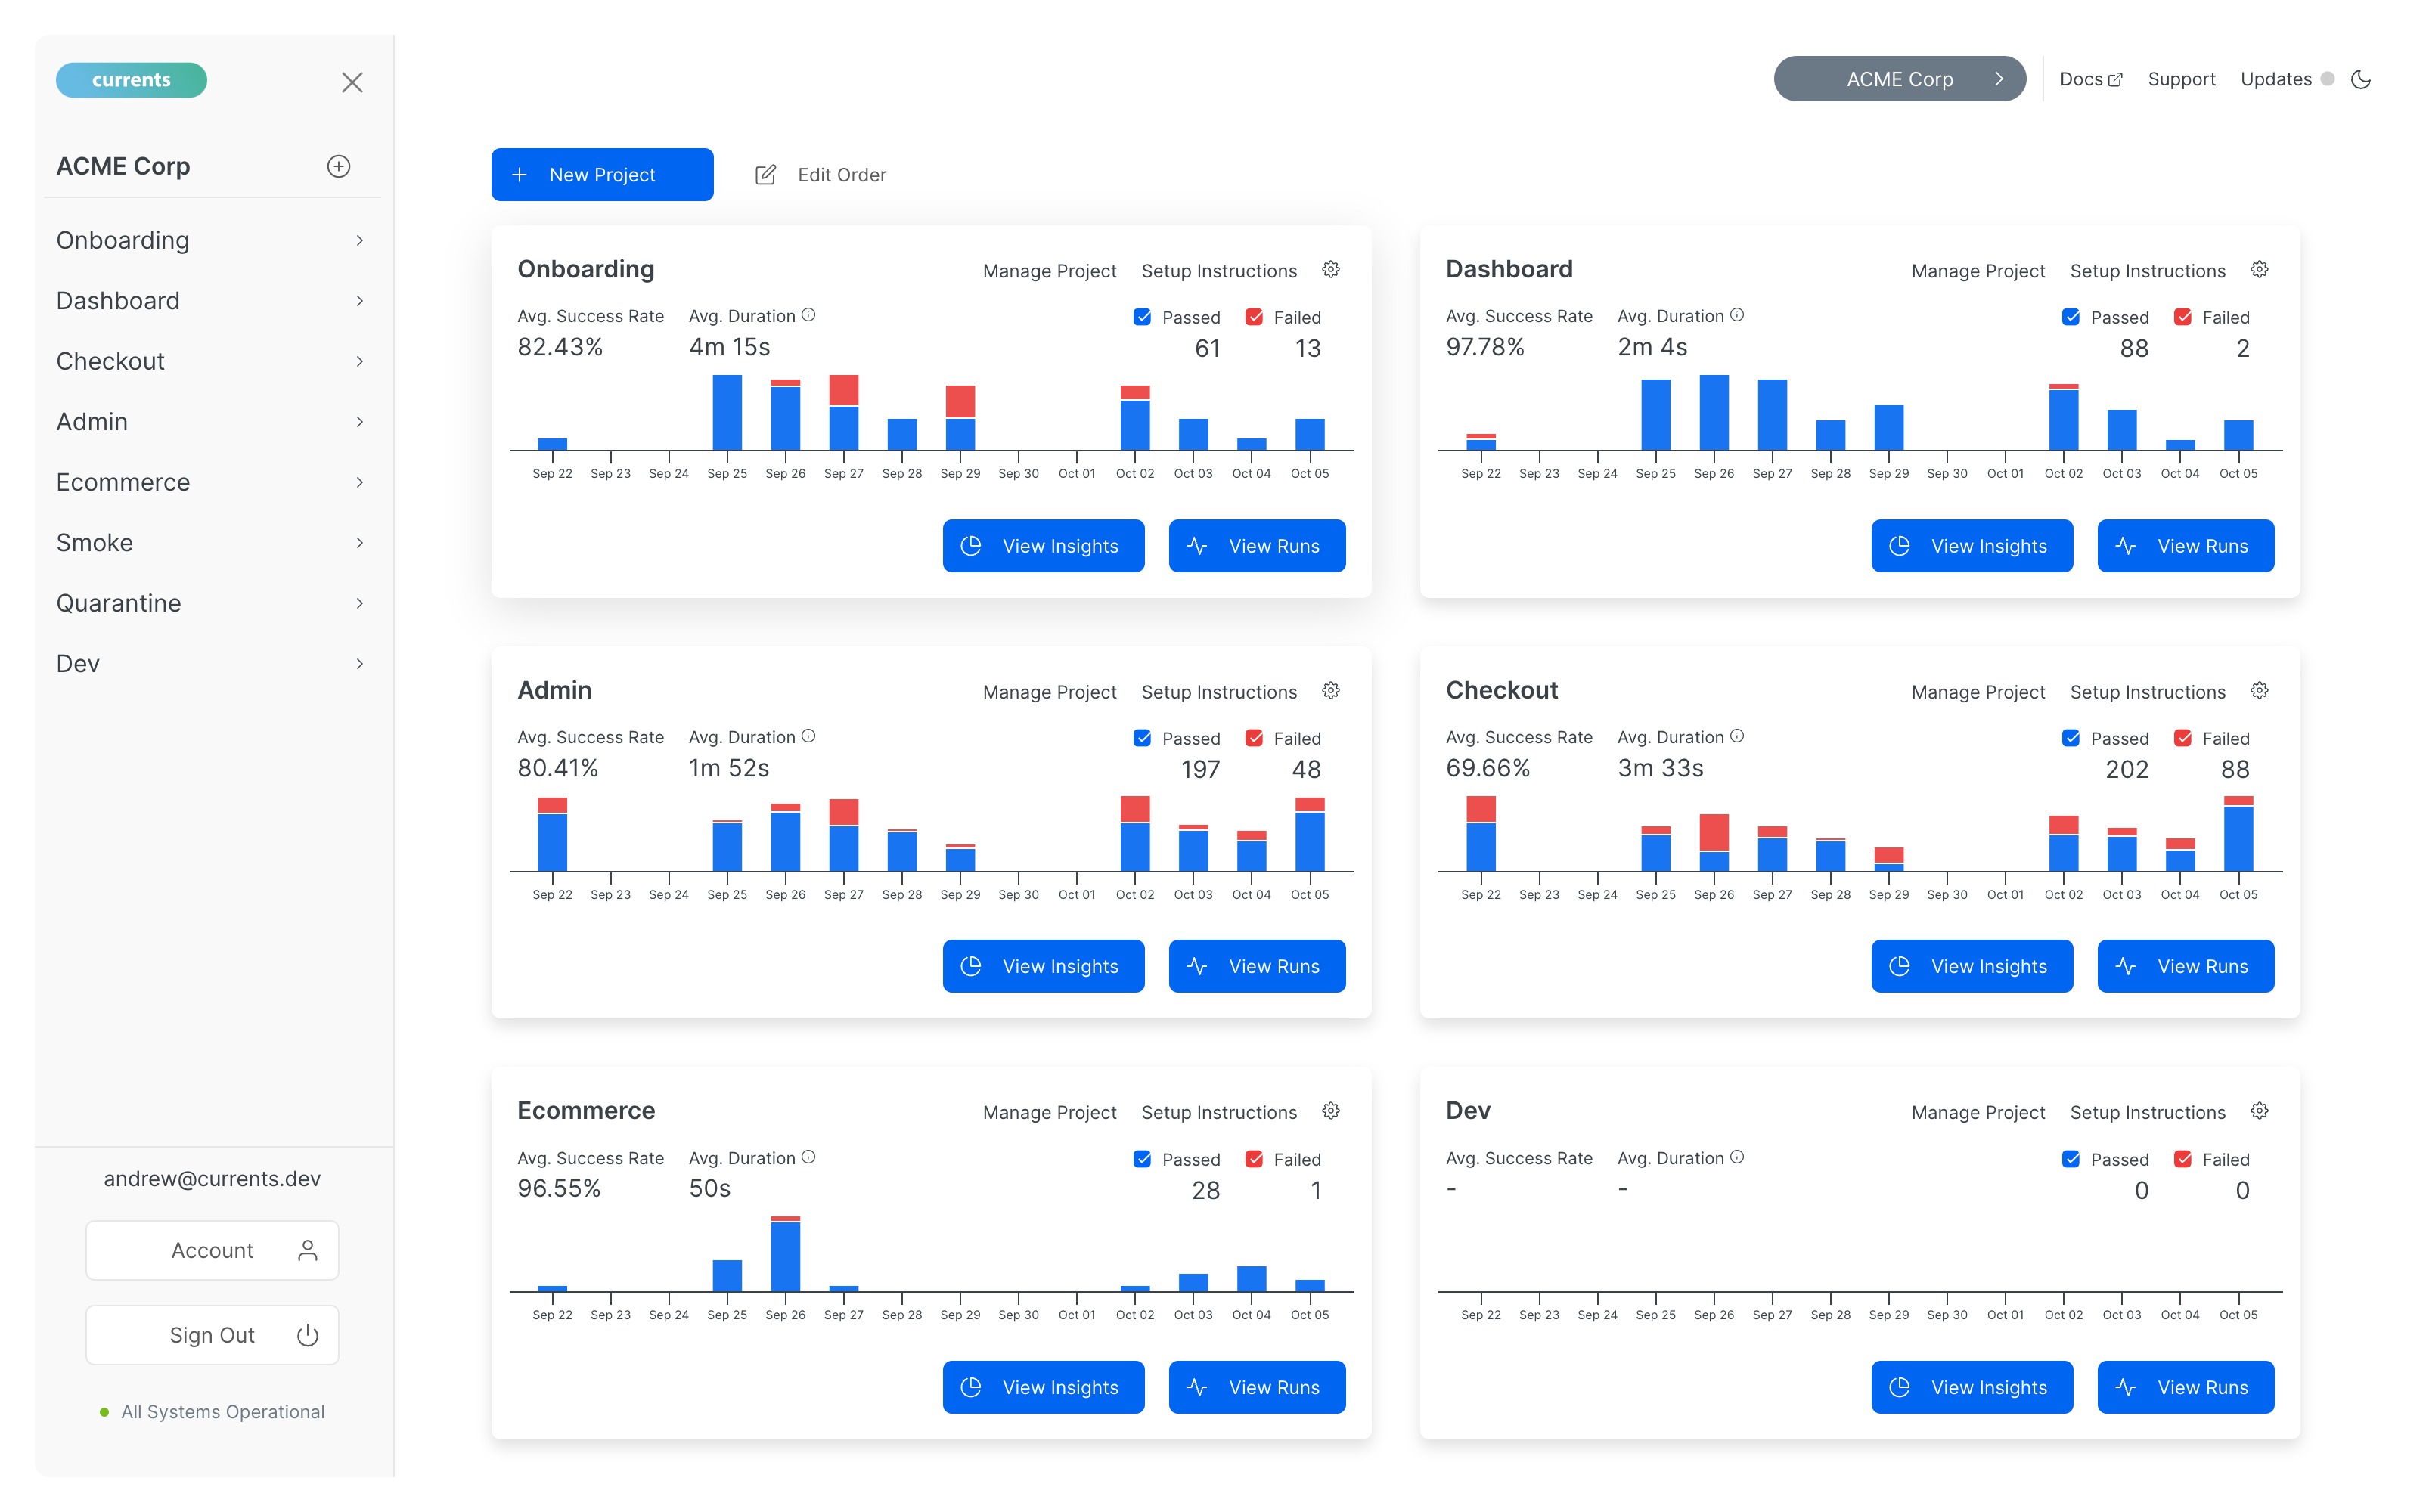
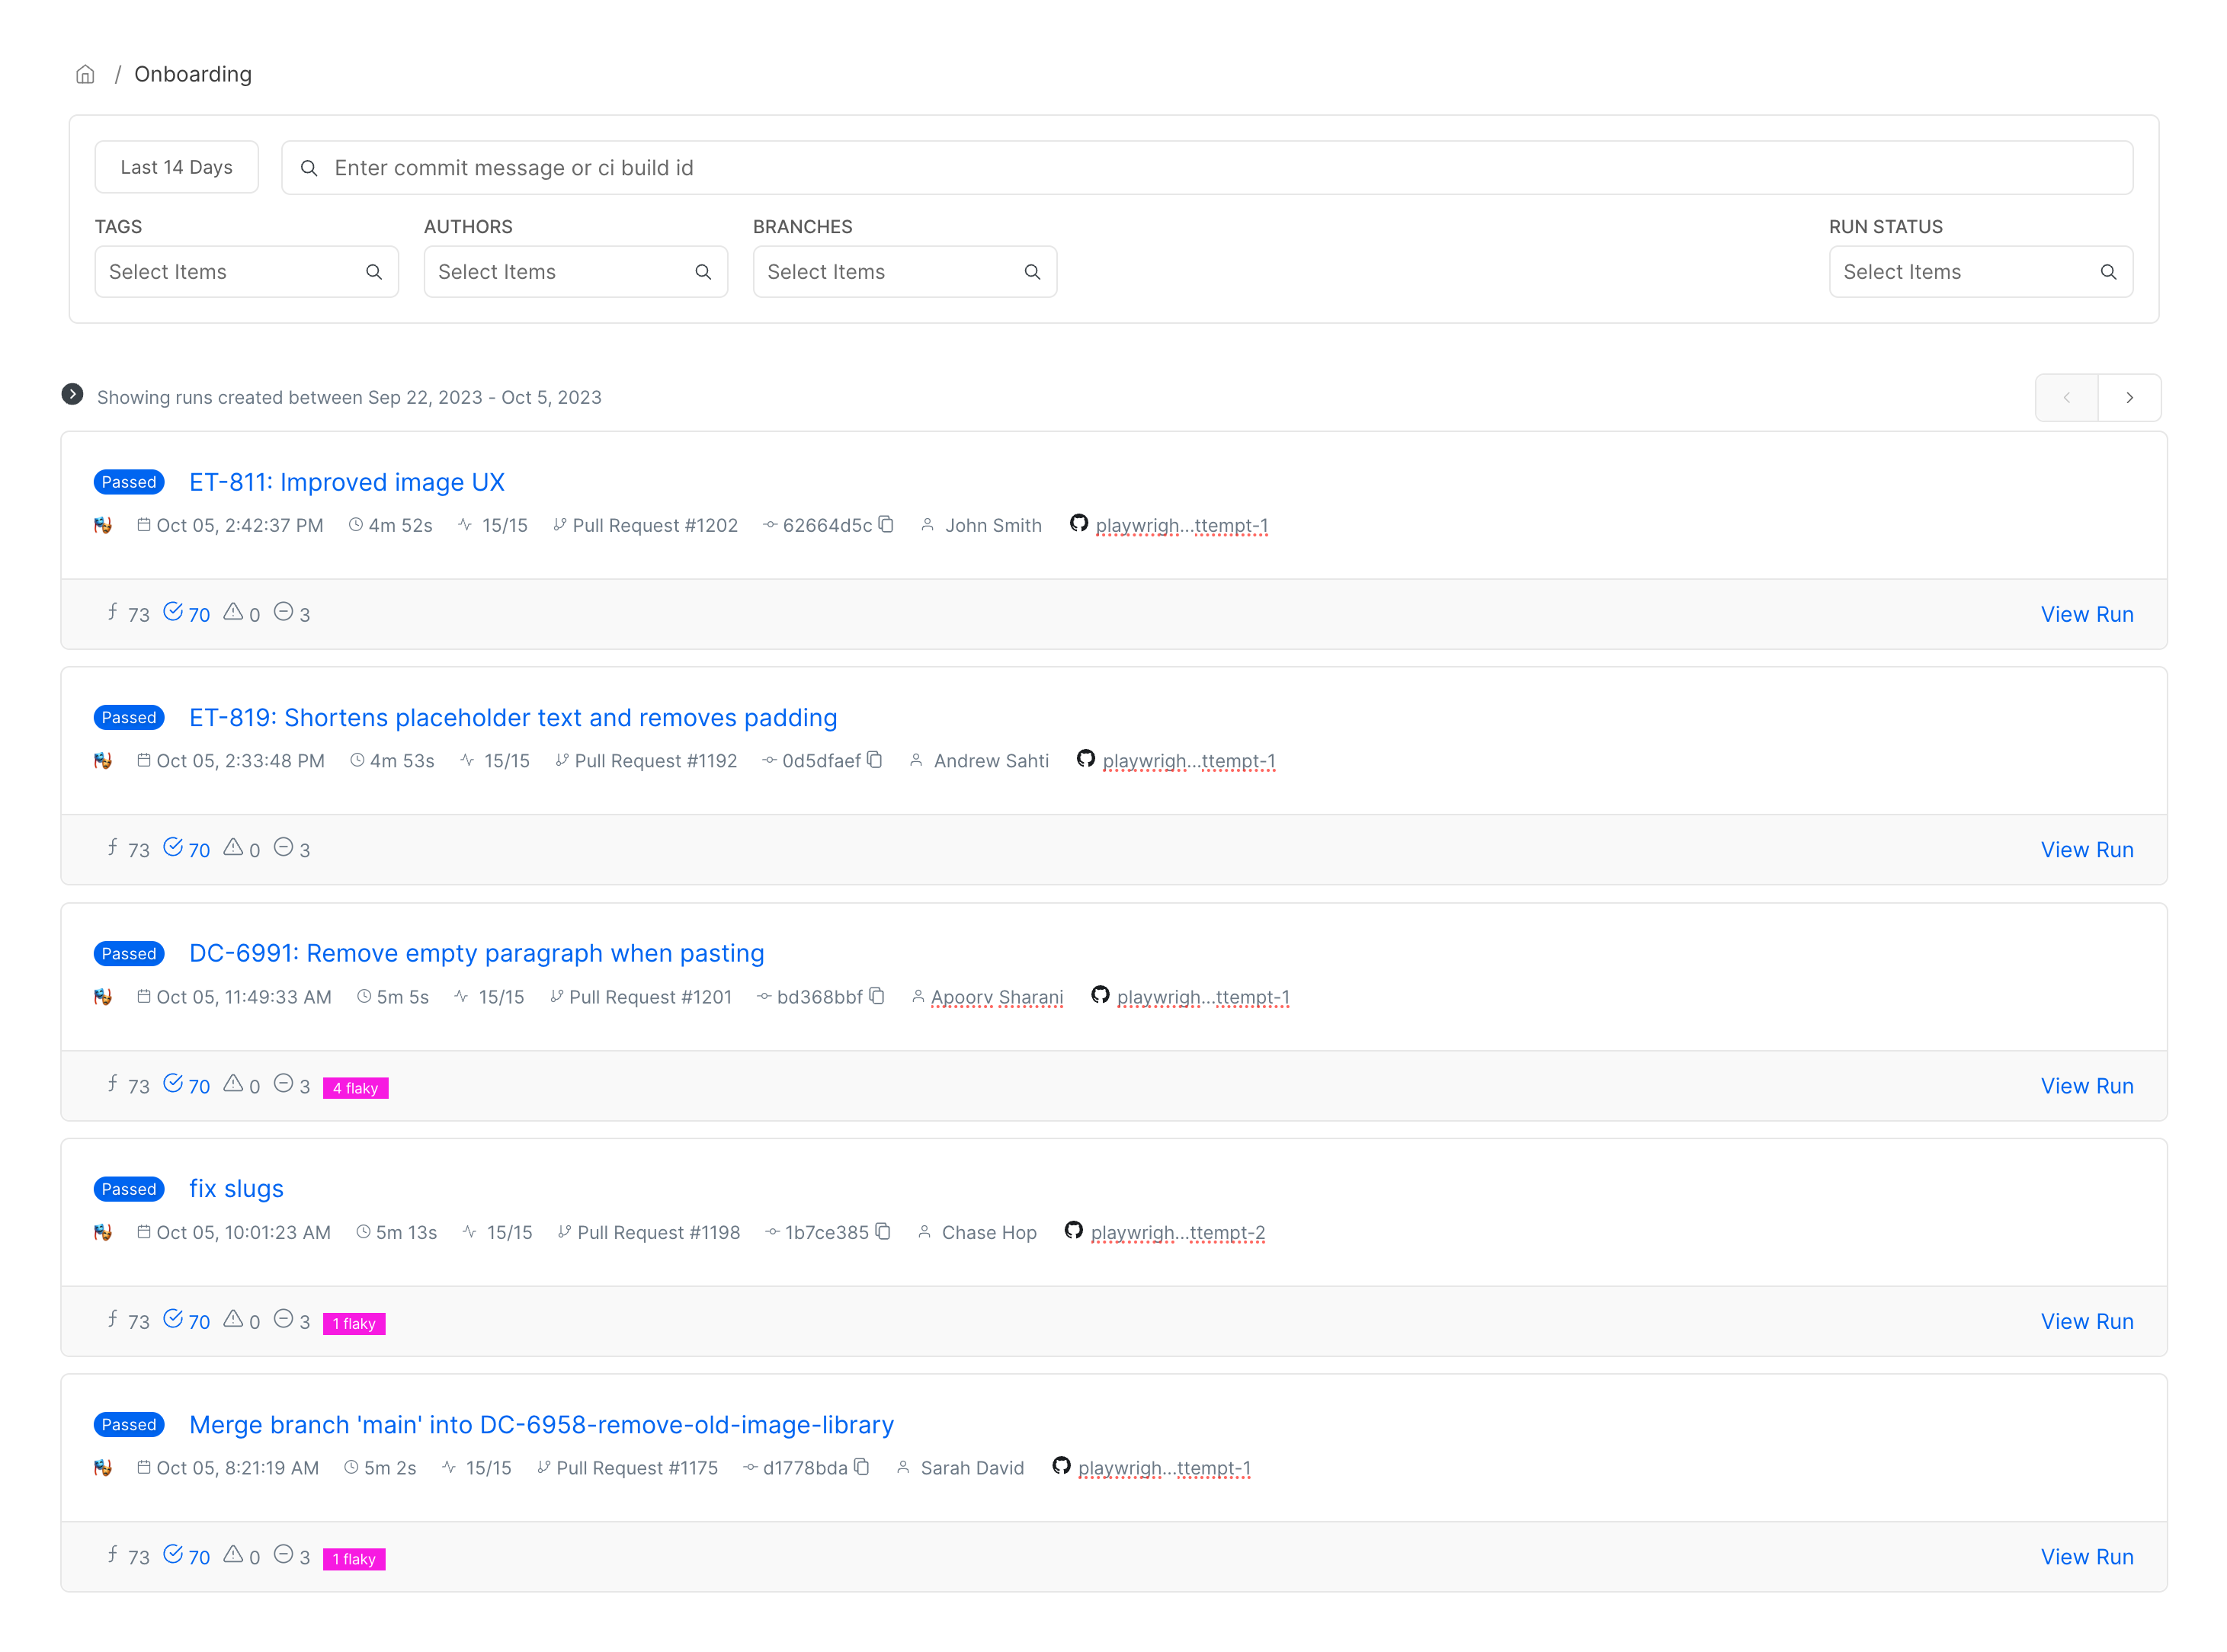
Currents collects test results from distributed, parallel Playwright runs with unified searchable view of the current and past executions for the whole team to review.

Individual Playwright Run Details
Each individual runs contains details about execution environment, progress and results for more effecient troubleshooting and debugging of failed tests. The collected data includes:
-
duration and timing
-
git commit information
-
progress and results
-
the most common errors
-
detection of flaky tests
-
screenshots, videos, logs, and traces
-
metadata and custom attributes (tags, annotations, etc)
Each run contains details about execution environment, progress and results for more effecient troubleshooting and debugging of failed tests

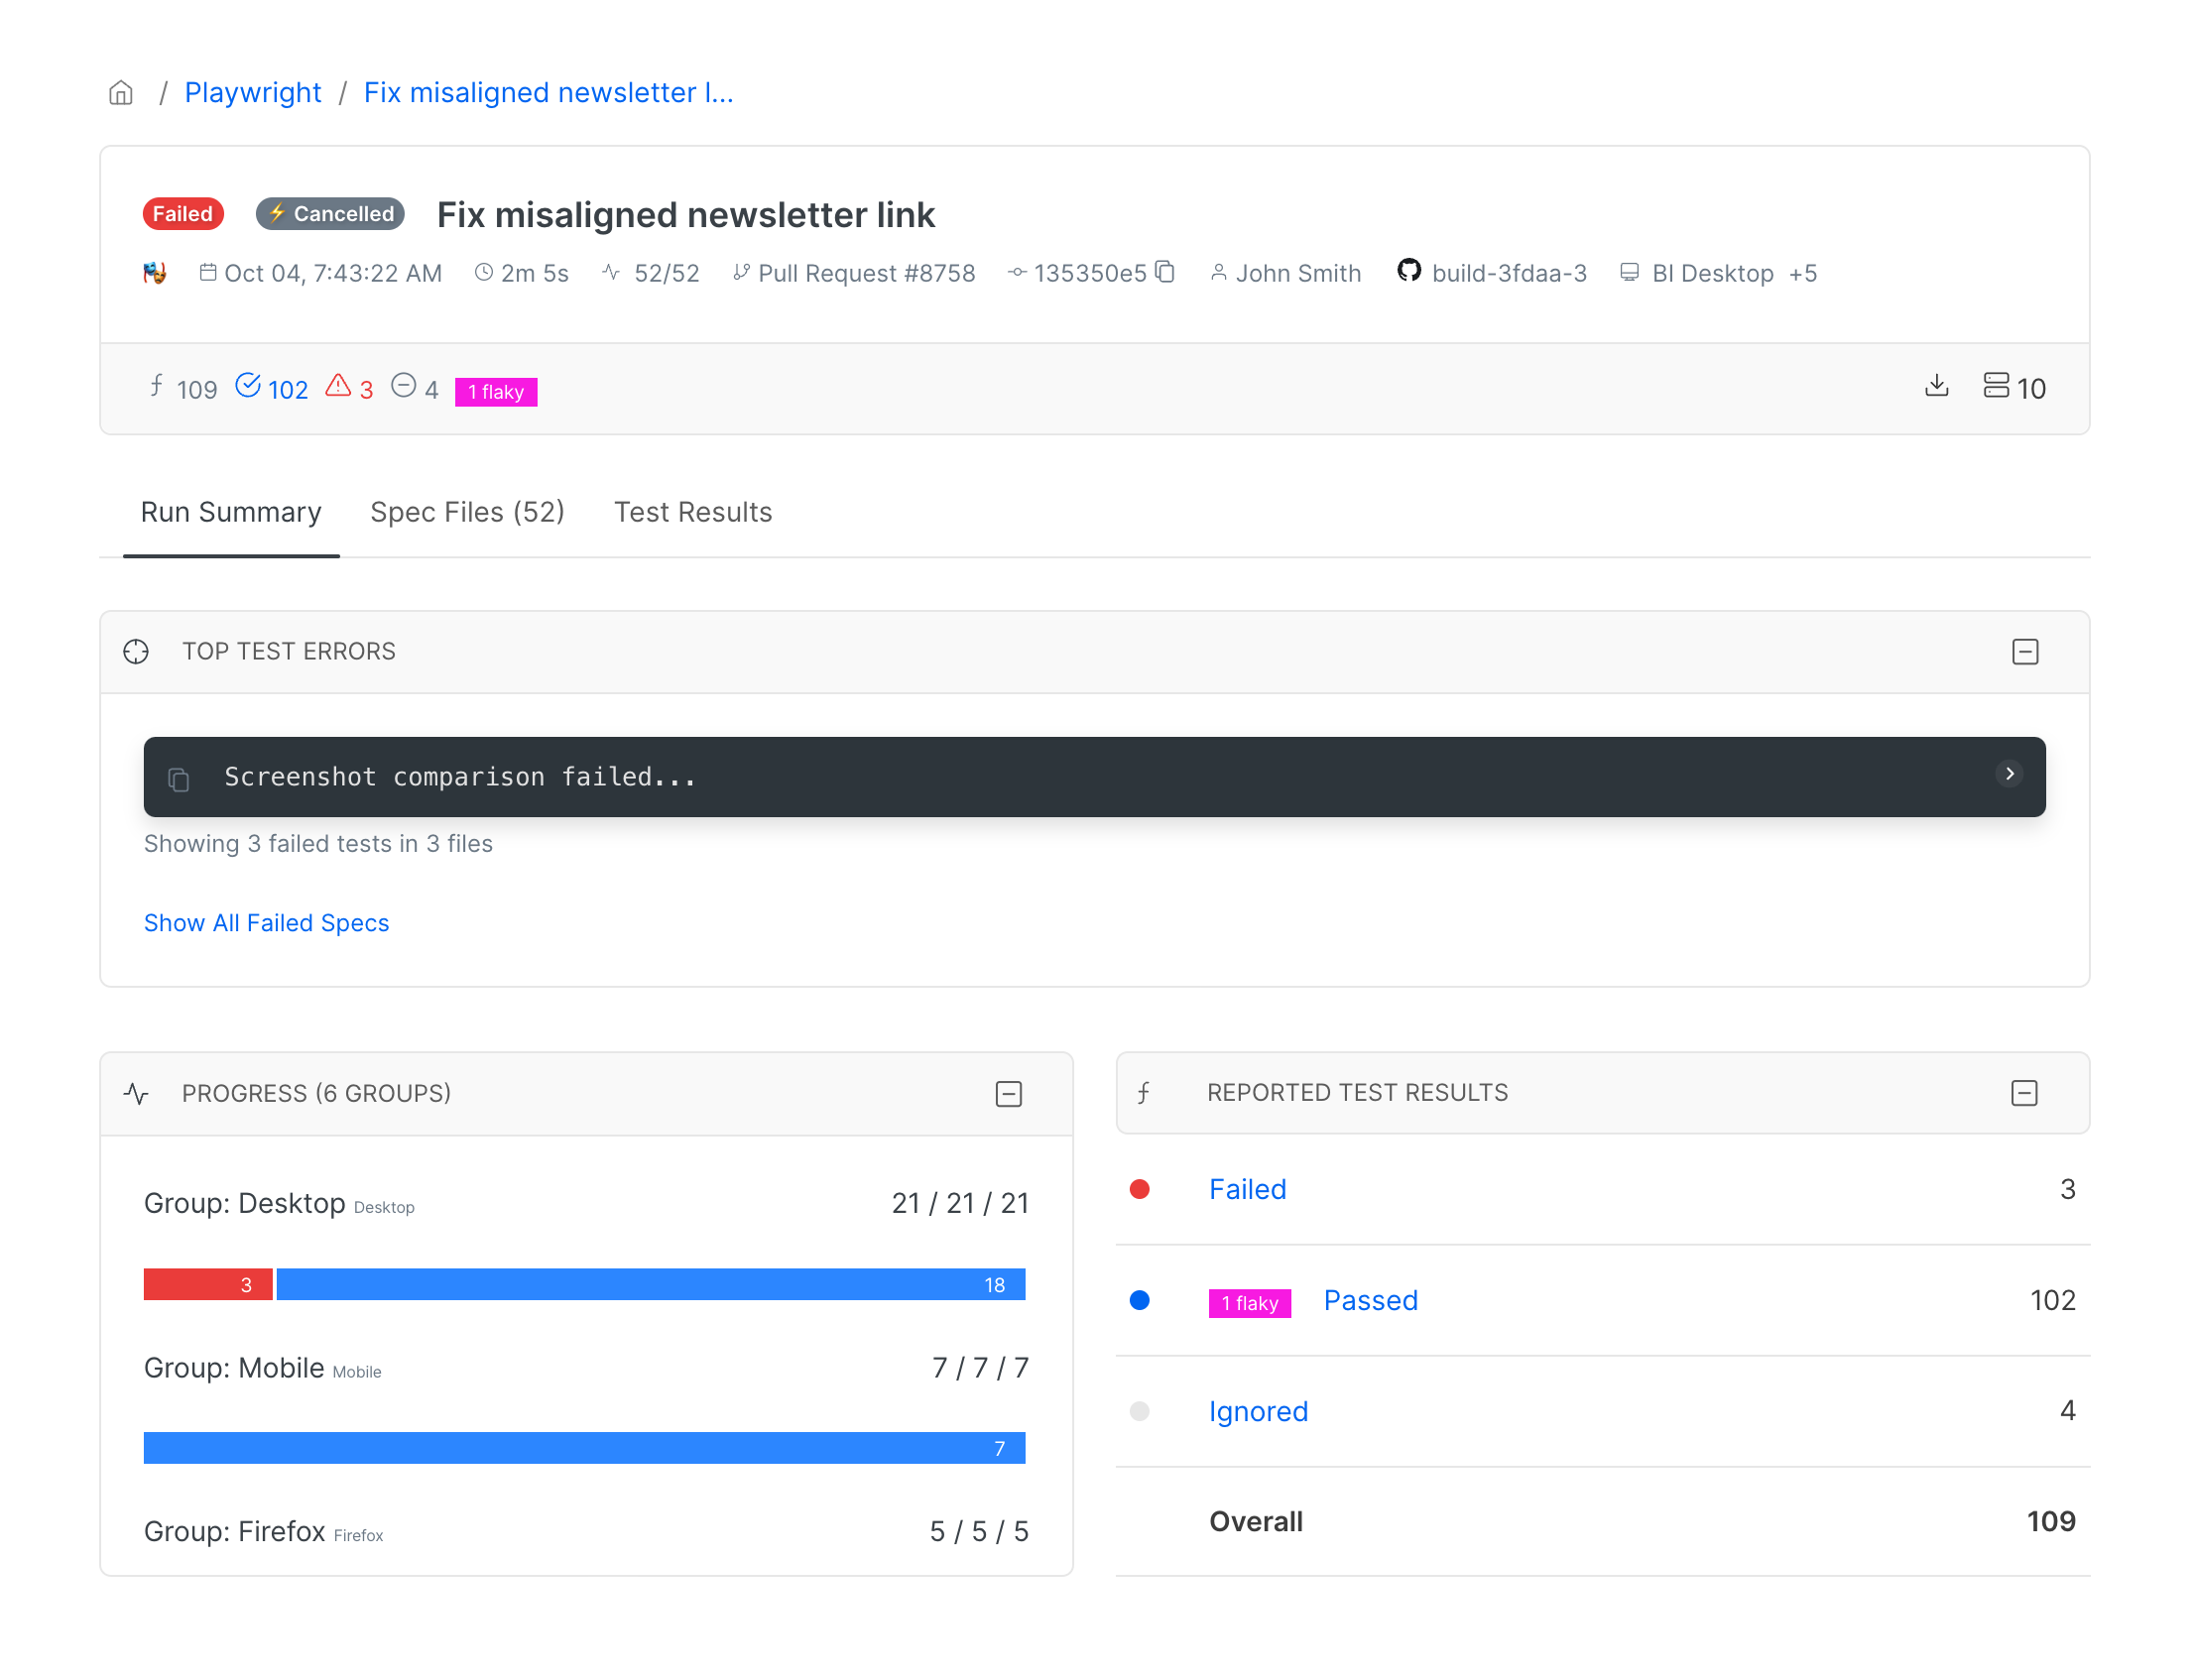
Identify the Top Failure Causes
Quickly identify the top failures for individual runs with a quick access to the associated tests and error details.
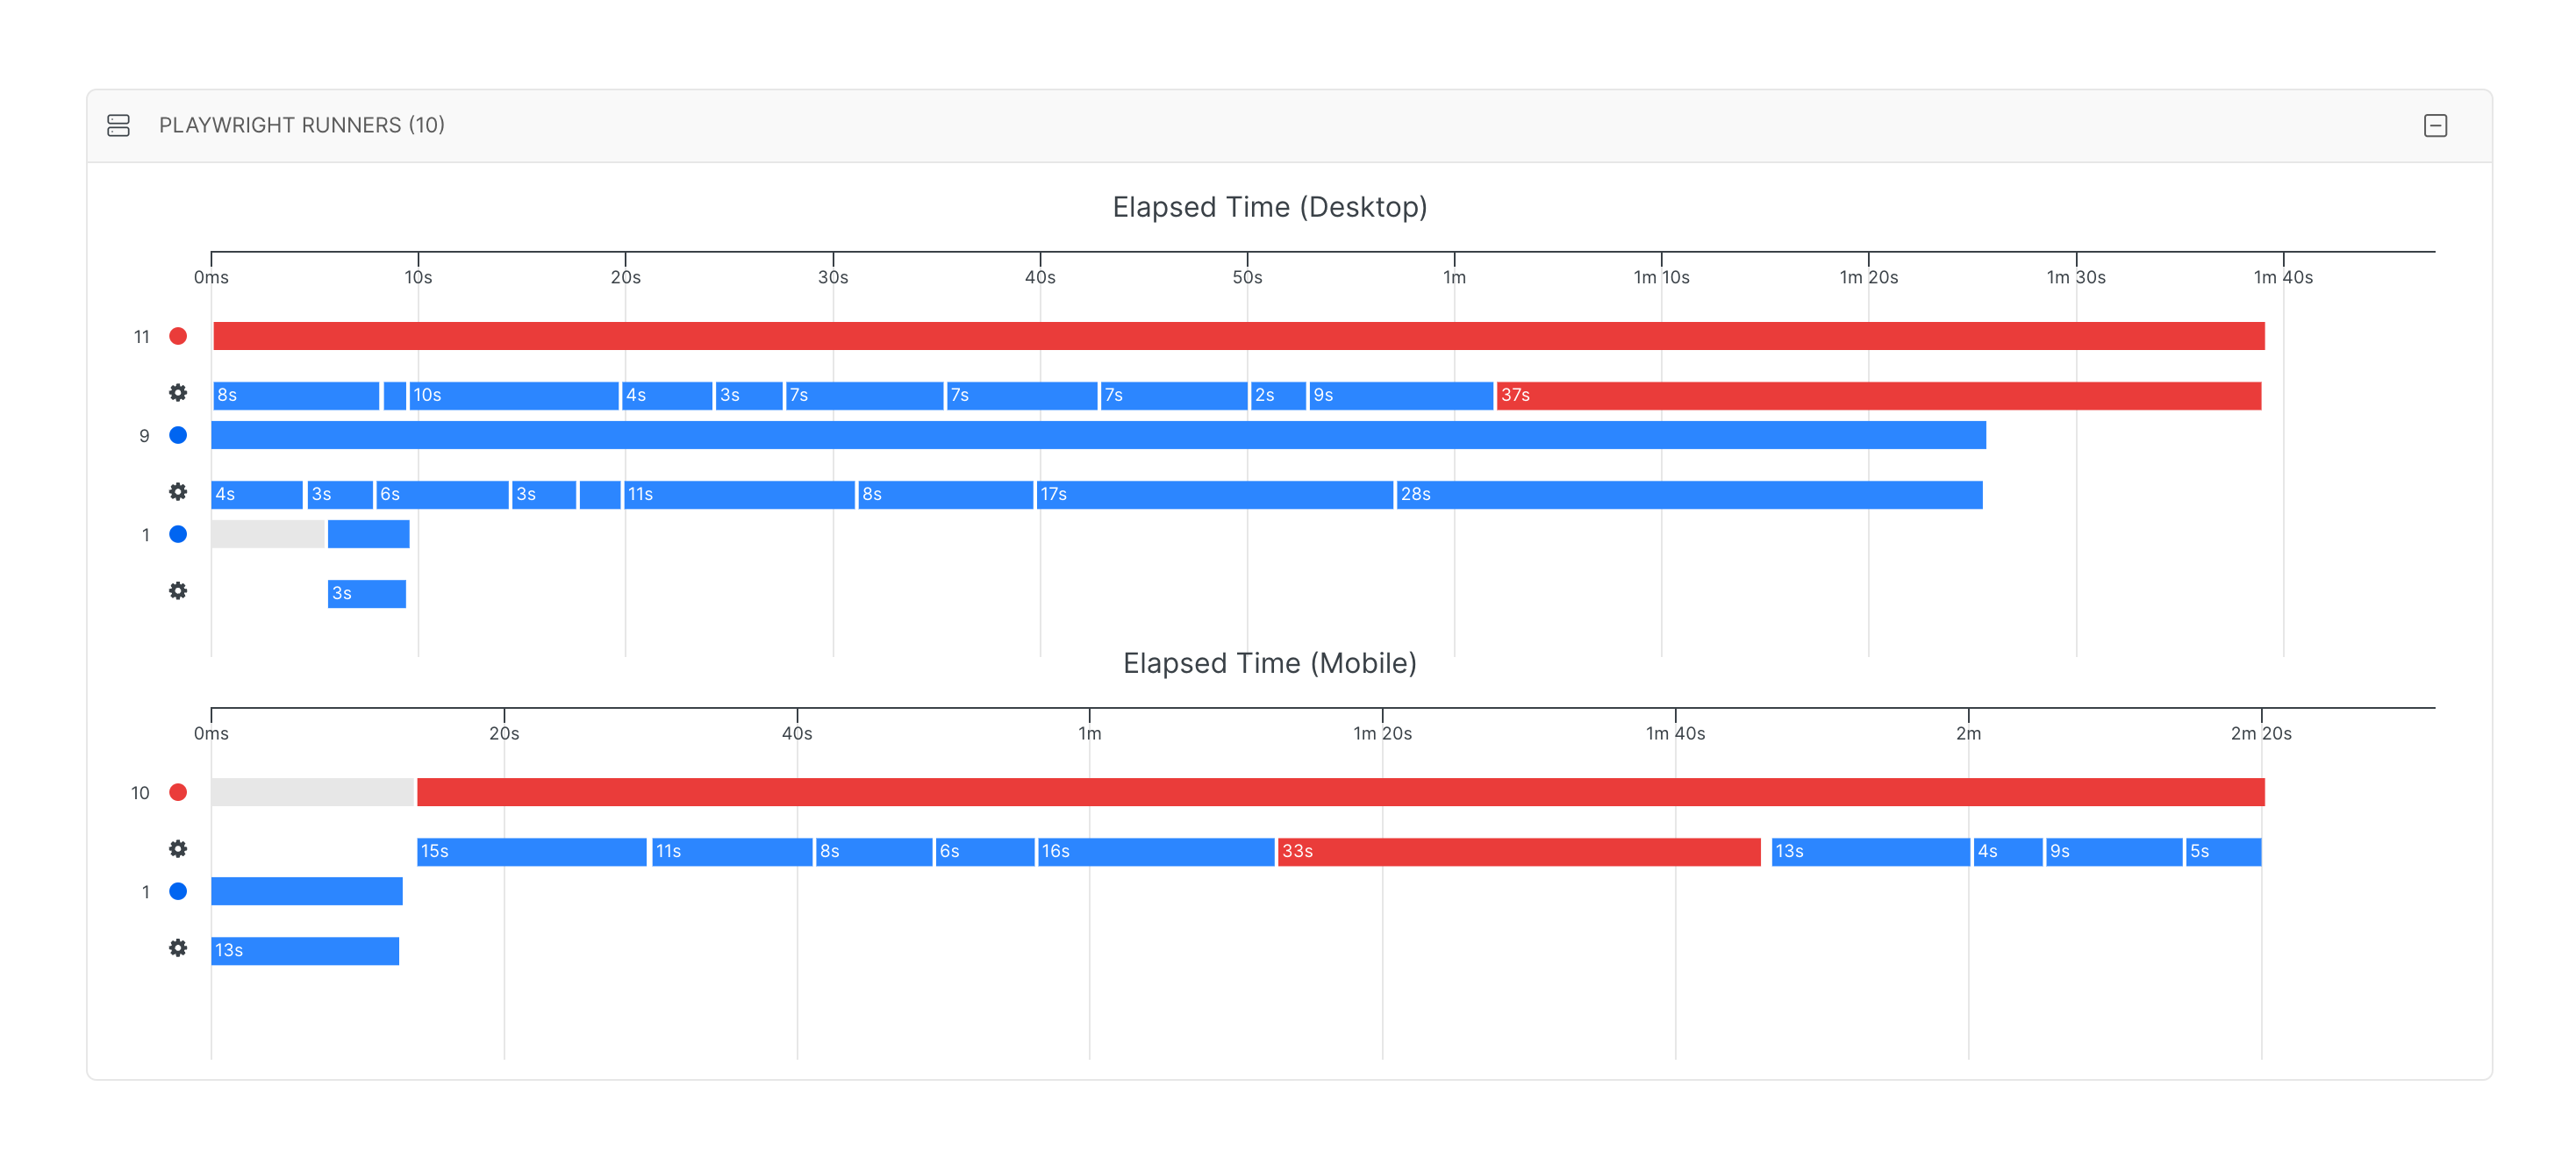
Visualize Tests Distribution
Track the progress and distribution of the tests across different shards and individual workers with a visualized makespan chart.

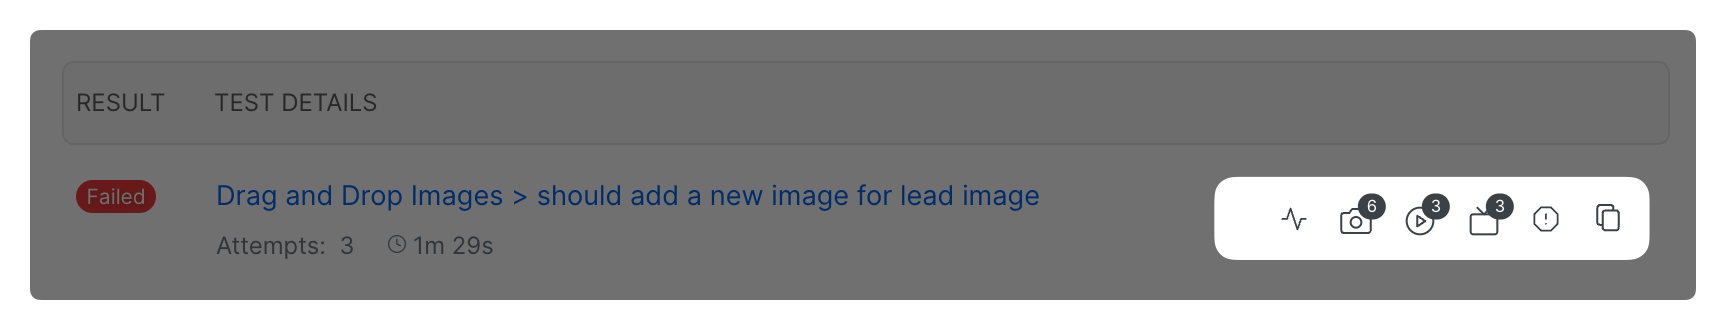
Debug Failures, Smash Flaky Tests
Quickly identify, explore and debug failures and flaky tests by accessing the artifacts collected by Currents:
- Playwright Traces (time-travel)
- Screenshots
- Videos
- CI terminal output
- Errors Source Code and Stack Traces
The artifacts are collected for each individual test attempt, and are stored on Currents' secure and encrypted cloud storage. They are available for the whole team to review and troubleshoot the failures.

CI Terminal Output
Currents captures the CI terminal output so you don't need to dig into the CI logs to find the relevant information - it is available right from the test results page.
Time-Travel with Playwright Traces
Playwright traces are a great tool for debugging failures and flaky tests. Currents collects the traces for each individual test attempt, and makes it easy to access them right from the test results page.
Test-Level Insights and Metrics
Knowing the context of a test failure lead to a faster resolution - having relevant information at hand makes the troubleshooting process more effective and easy.
By having access to previous execution results, Currents is able to provide test-level insights and metrics:
- Past executions history
- Top errors causing failures and flakiness
- Duration, failure rate and flakiness rate
Having access to the data that is beyond just a single failure empowers your team to keep the test suite healthy and reliable.
Tests Executions History
Often it's enough to have access to a single execution result, but having an easy access to historical results of the same test, or to executions from a different branch provides a better context for troubleshooting and debugging.
Currents stores the test results history for each individual test, and makes it easy to access the previous recordings - that empowers the developers to more effectively compare the results to make sure the test is behaving as expected, and also to identify the changes that caused the test to fail.
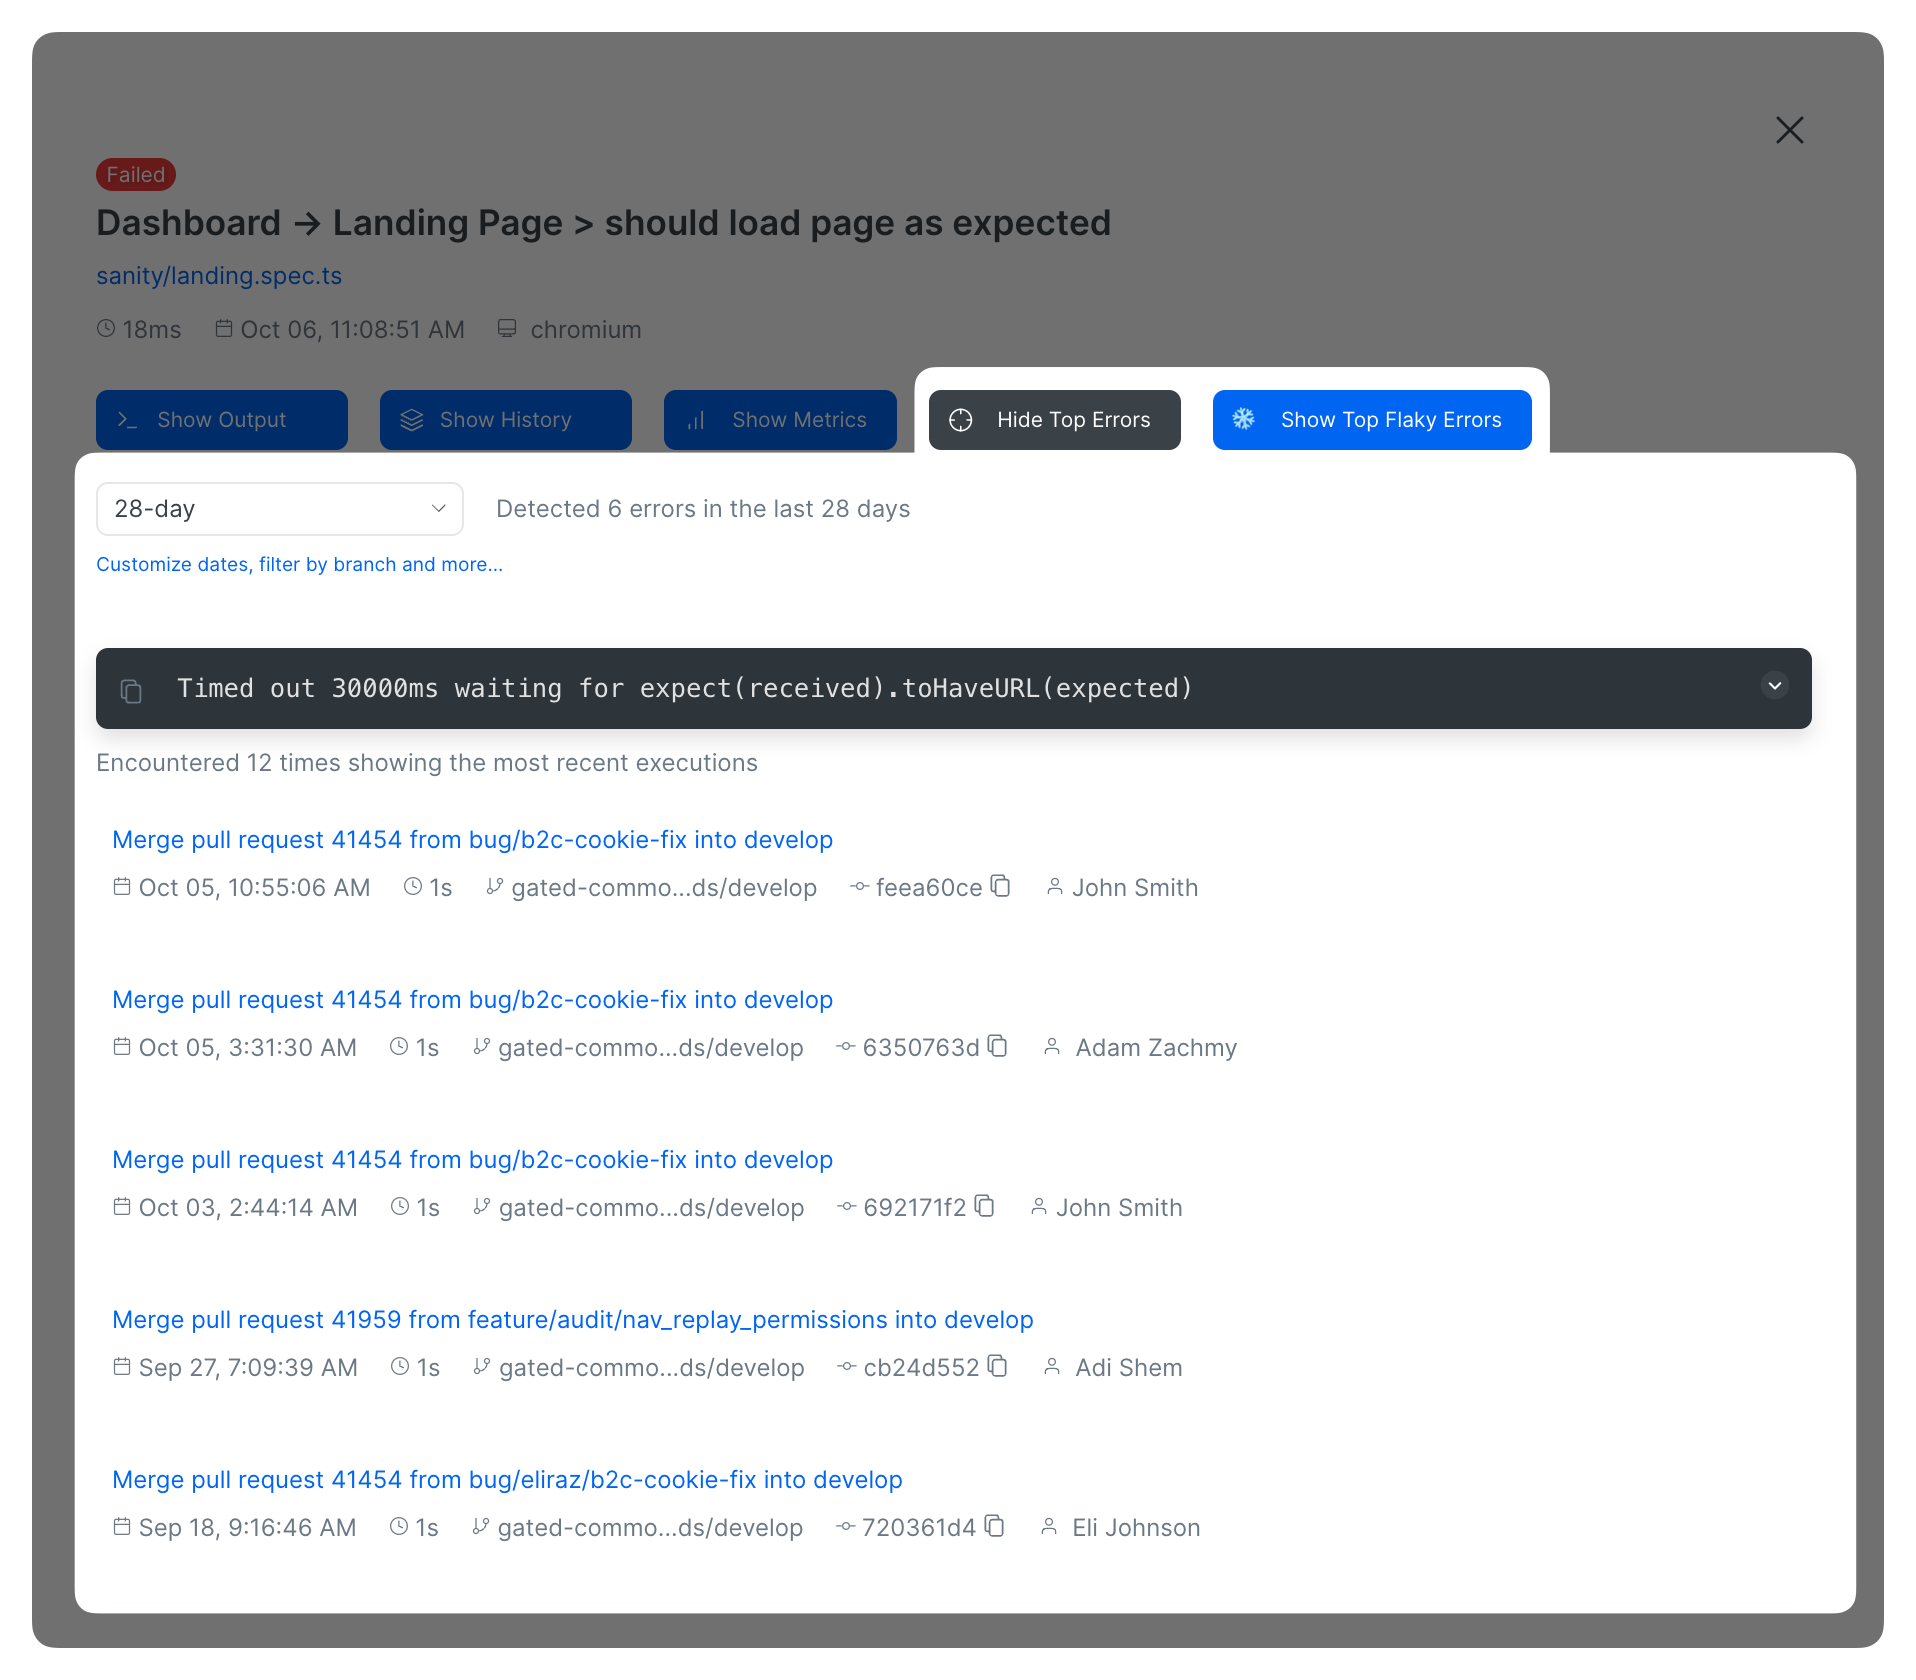
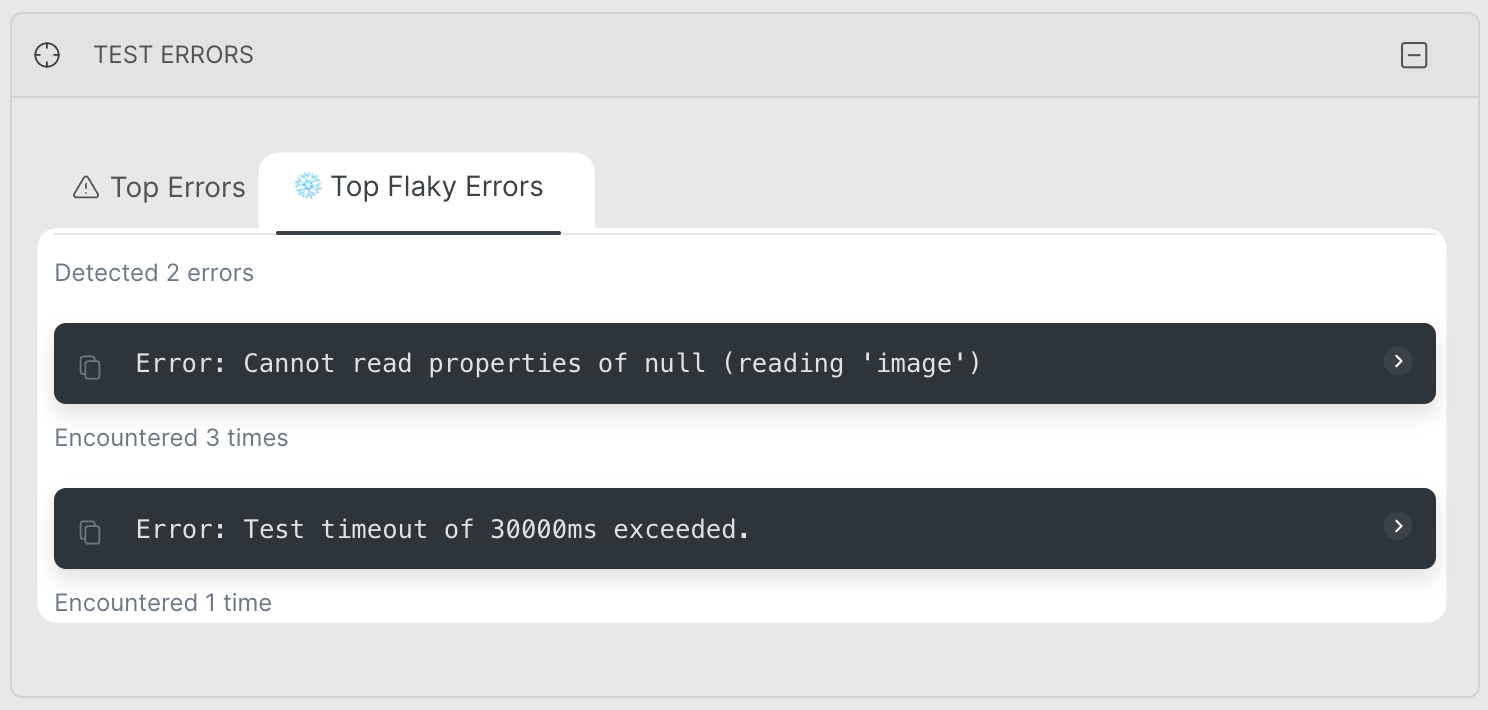
Top Errors Causing Failures and Flakiness
Some error messages are more common than others - and resolving those errors first will help to reduce the whole category of failures, unblock your CI pipeline and probably identify more generic issues in your application.
Currents tracks error messages for each individual failed test attempt, and provides a quick access to the most common errors that cause failures or flakiness.

Individual Test Performance
Discover the changes and trends in your tests behavior and dont' let the test suite performance degrade.
Currents tracks the duration, failure rate and flakiness rate for every individual test, so you can measure, identify and fix the regressions in the test suite performance.
Analytics to Drive Your Testing Strategy
In addition to having test-level information, higher-level metrics like:
- runs success rate
- runs duration
- test suite size
- test results distribution
- test flakiness rate
allow teams to have visibility into the test suite performance, identify the trends and track organizational goals.
Currents collects the necessary data for Playwright executions and allows creating custom reports. aggregrated on daily, weekly or monthly basis. The charts can be fine-tuned and filtered by date, git branch, tags, authors, etc.
You can download the generated reports as a CSV file or get programmatic access via HTTP REST API.
Teams are using the insights to get answers to questions like:
- Show me the flakiest tests from the last 30 days for main branch
- Has our test suite performance improved over time?
- What is the average run duration? Did it change recently?
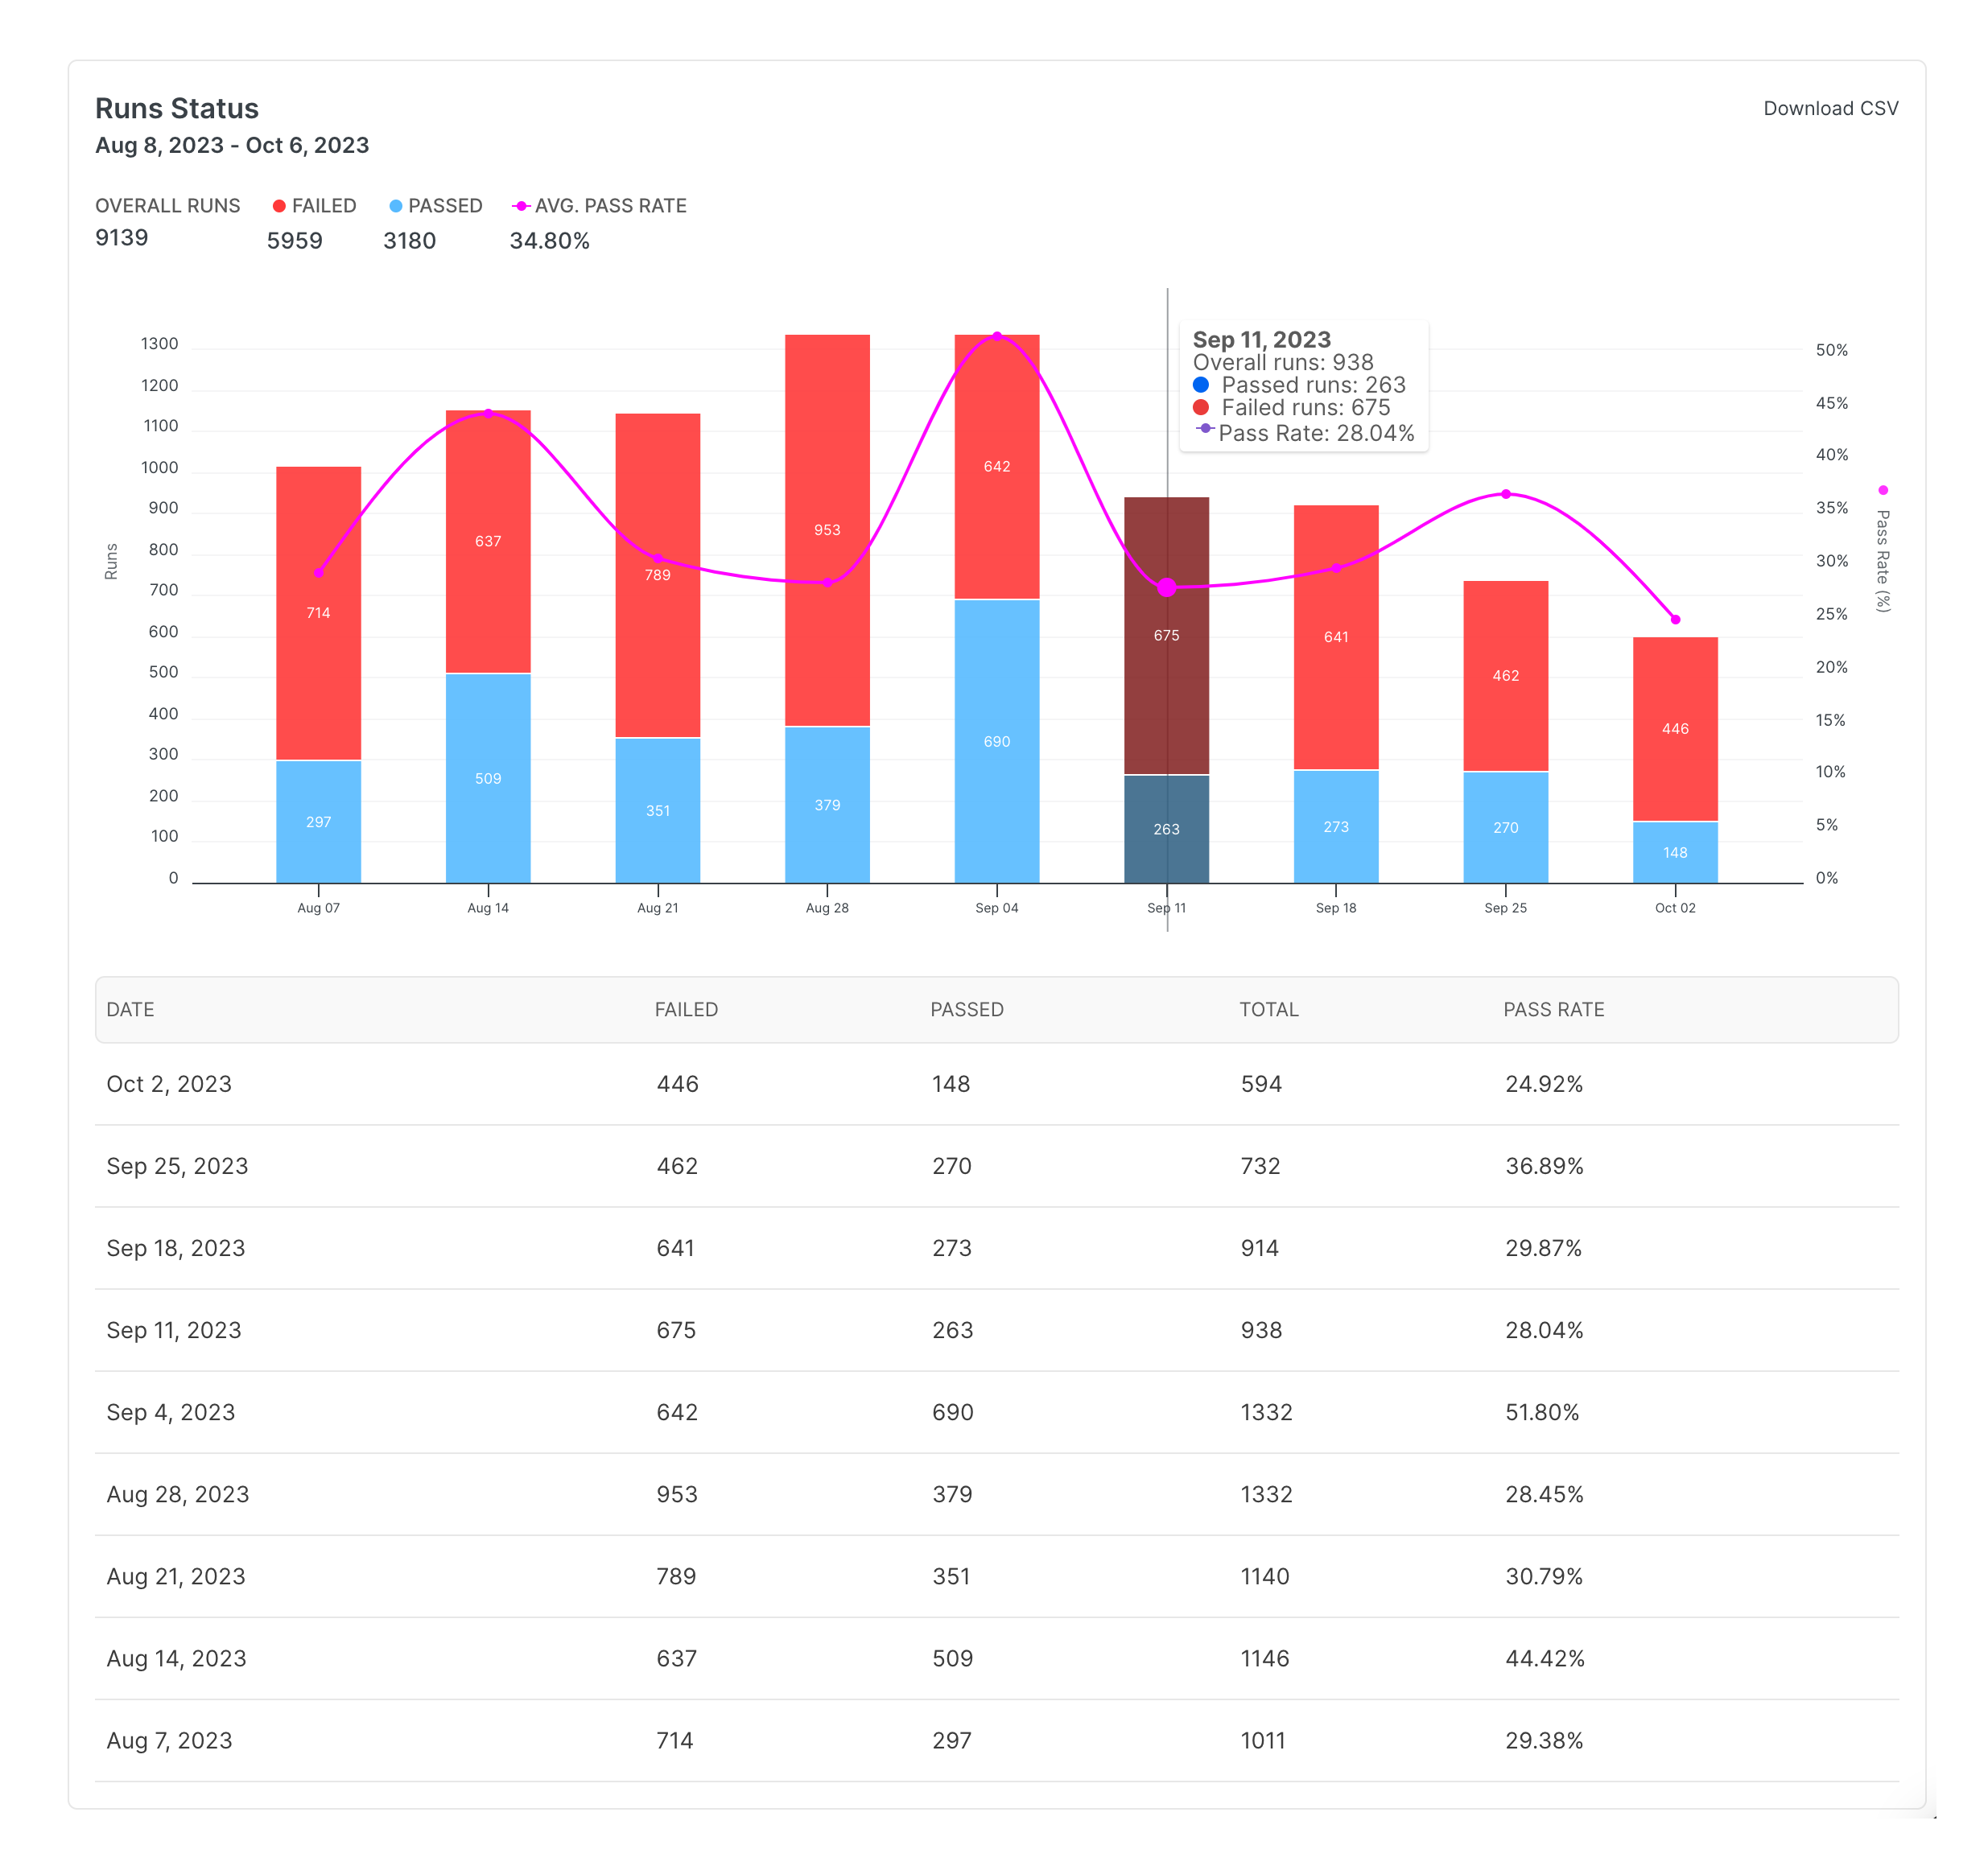
Explore the available charts and reports below 👇.
Runs Status report shows the distribution of Playwright run results and runs success rate over time.

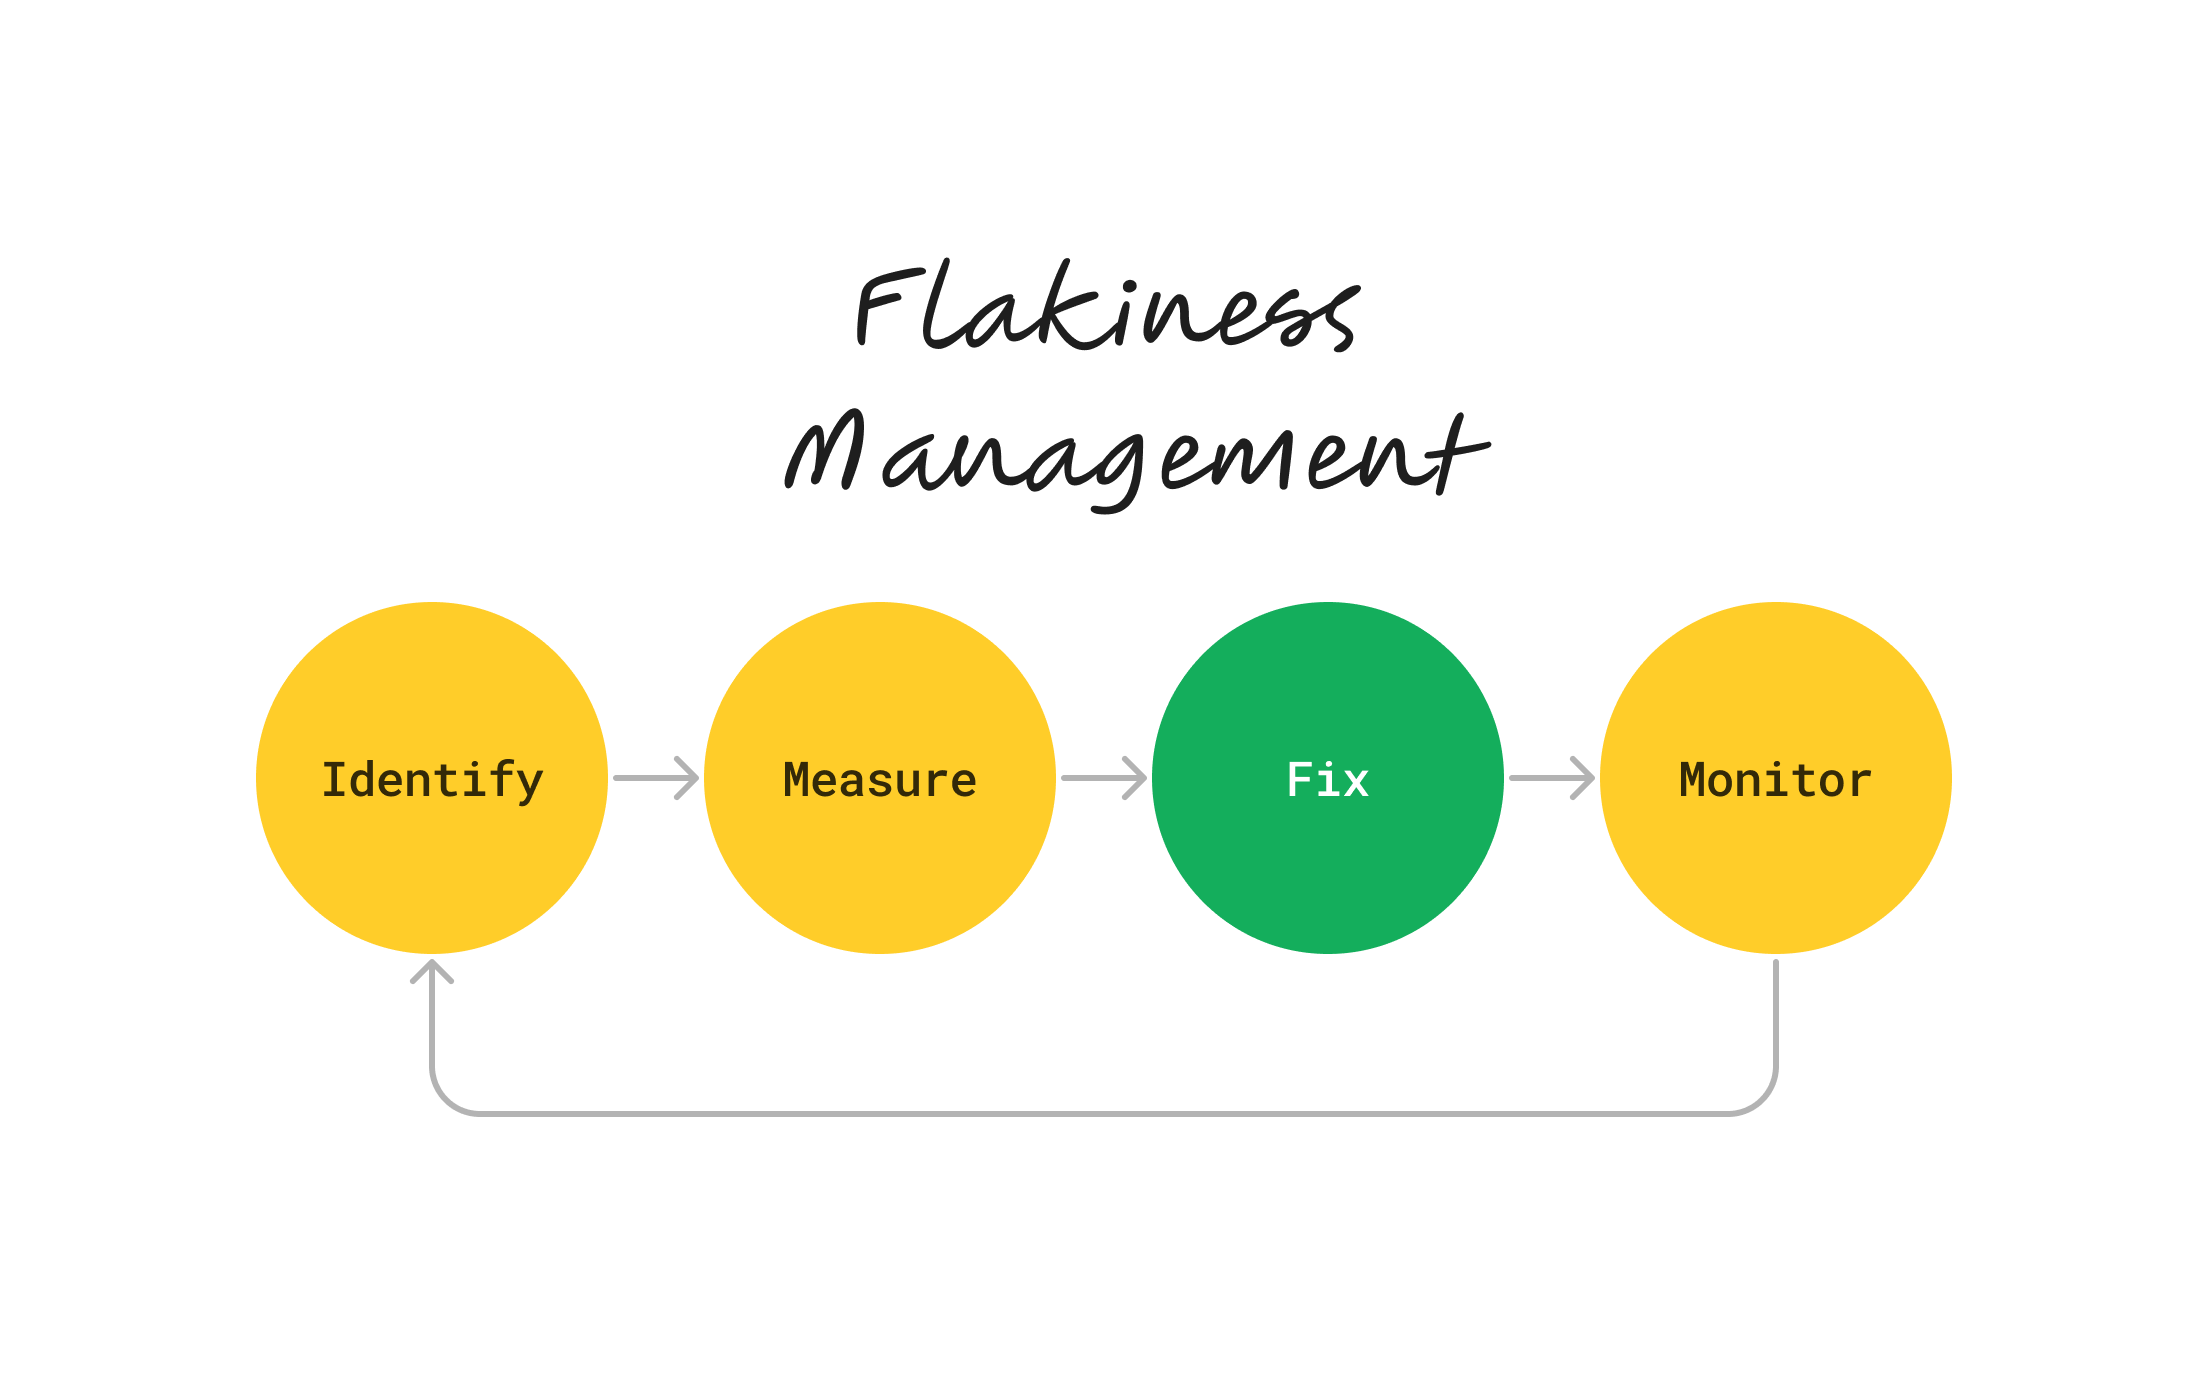
Managing Flakiness
A flaky test is a test that sometimes passes and sometimes fails. Flaky tests are annoying - they block you CI pipeline, waste CI resources, frustrate your team and undermine the trust in your test suite.
Managing flakiness becomes relevant even at early-stage companies - 3+ engineers and a dynamic product can generate enough turbulence to start producing flakiness.

Currents helps with keeping the flakiness under control by providing the tools to:
- identify flaky executions
- measure flakiness rate for individual tests
- measure aggregated flakiness rate for the whole test suite on a project level
- hunt down the flakiest tests and explore the flakiness reasons
- automatically detect changes in test flakiness and alert the team
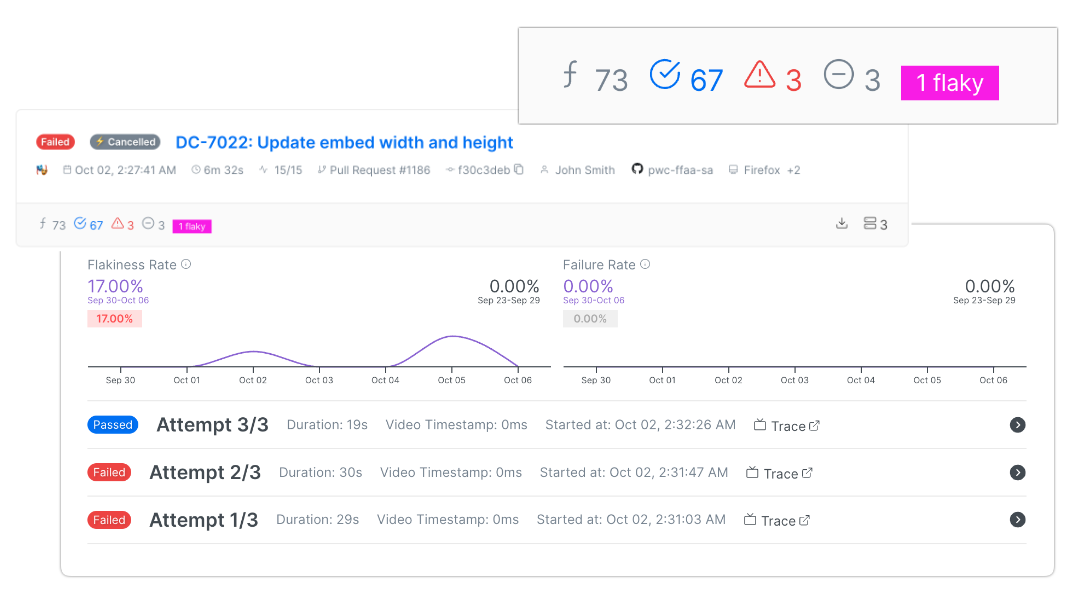
Identify Flaky Playwright Executions
Invidual flaky exections are highlighted in the resuts, in addition Currents tracks flakiness rate for each individual test.

Resolving Flakiness
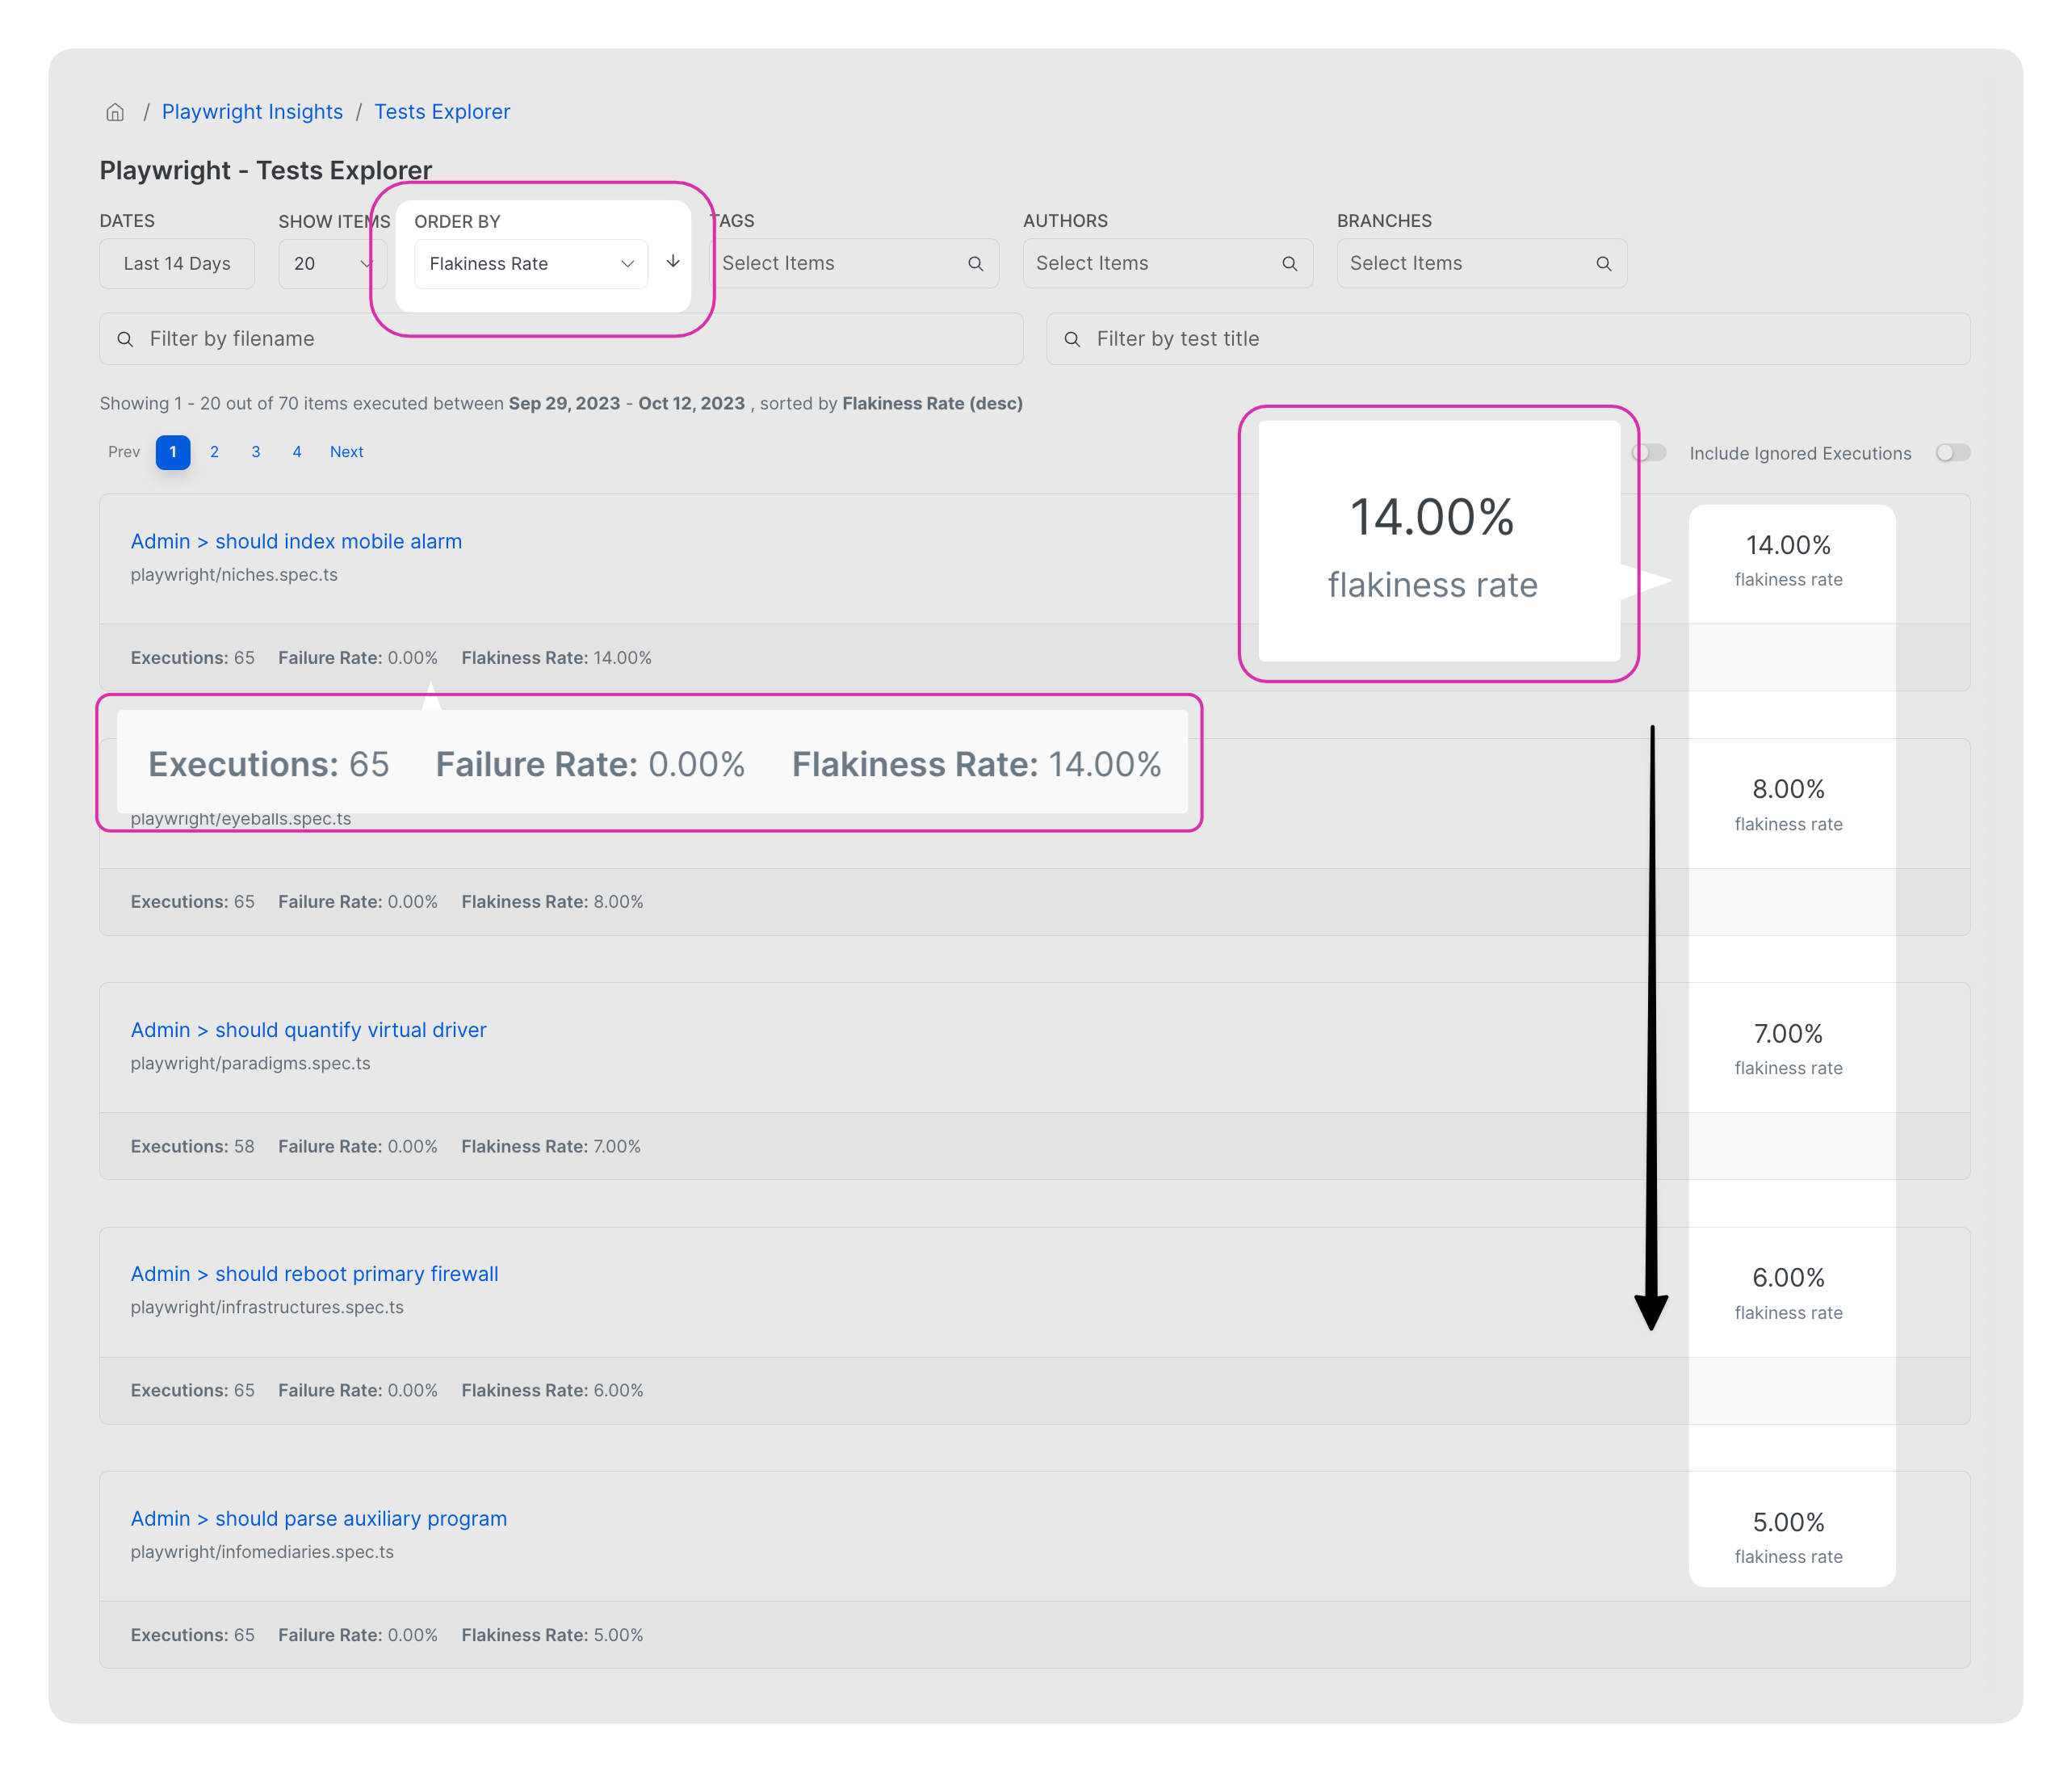
Currents collects flakiness rate for each individual test and shows the list the tests in Tests Explorer would reveal the most flaky tests, optionally filtered by tags or git branches.
The most flaky tests are showing up at the top - you can prioritize the tests for fixing and also track the progress of your flakiness reduction efforts.

In addition to aggregated flakiness metrics, you also can explore the individual flaky executions of a particular test, together with the most common errors that triggered the failures.

Monitoring Test Suite Performance
Often changes in tests behavior can go unnotices for weeks - a tests starts to be flaky, or increase its duration, but the team is not aware of the changes.
Currents automatically detects the changes in test flakiness, duration and failure rate and send a weekly report with so that you can take an action.

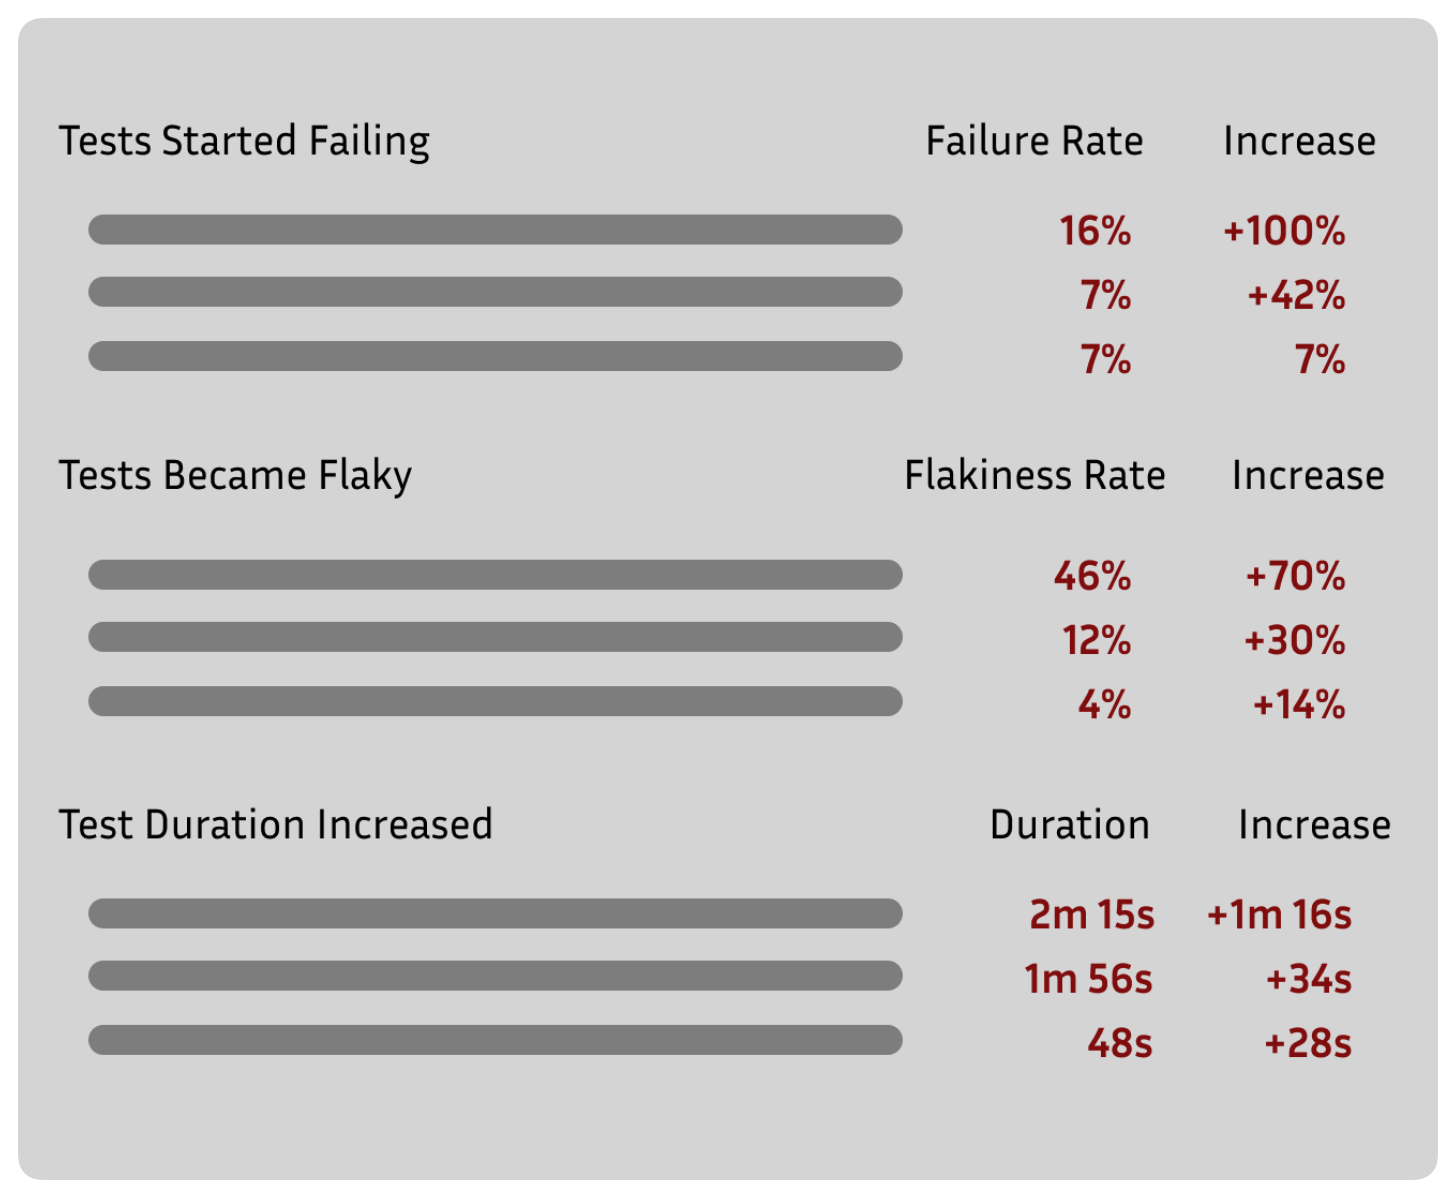
Read more about Currents Automated Reports.
Integrations
Having the test results reported right where your team is hanging out is a great way to popularize the culture of writing and fixing tests.
- Slack - get the test results right in your Slack channel
- GitHub or GitLab - post the test results as PR comments and / or status commit checks
- Additionally available integrations - Microsoft Teams, BitBucket and more...
Other integrations are available, and if there's no native integration for your tool, you can use the Currents Webhooks to build your own and integrate test results your existing workflows.

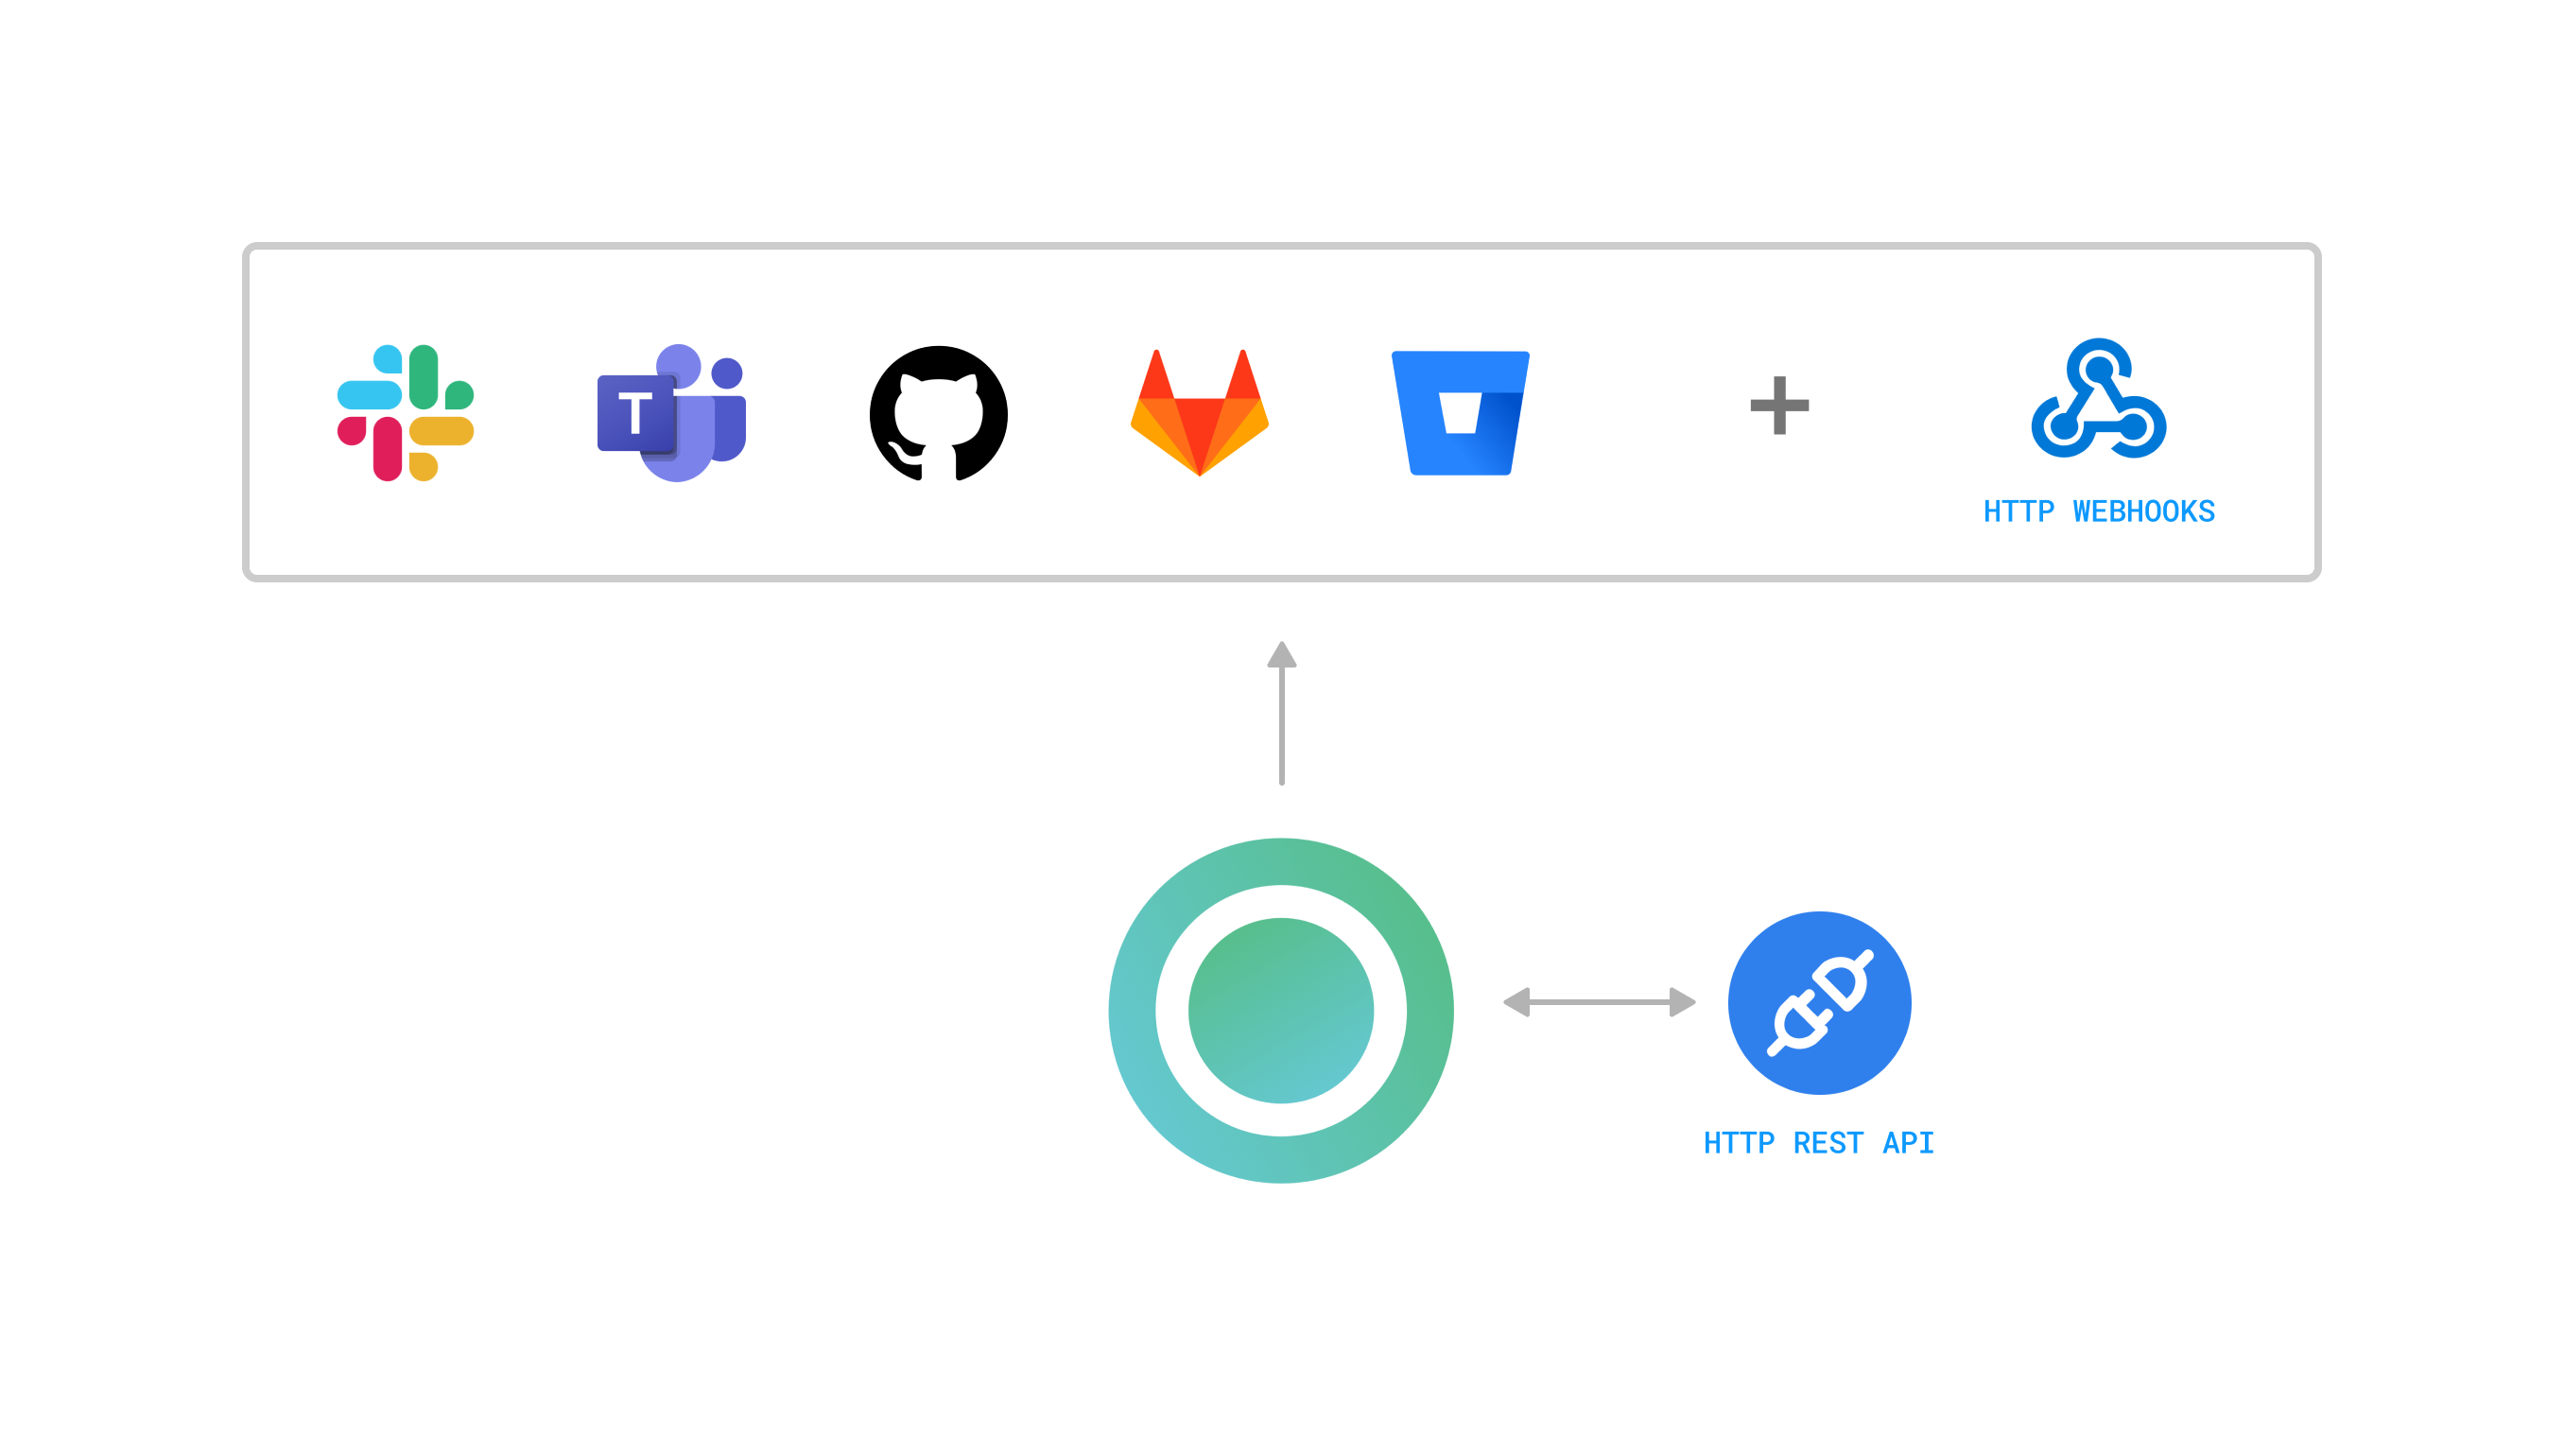
In addition, Currents HTTP API provides programmatically access to the test results, analytics and artifacts for your custom integrations and automation.
Debug Playwright Tests in Cloud
Our customers are telling us that Currents is a great productivity amplifier for their team - usually it replaces internal test management tools or integrates with the existing ones (Datadog, Splunk, etc).
We have been helping hundreds of companies ro run and manage their test suite at scale, processing millions of test results every month. Customers love our professional and responsive support, we are happy to listen and incorporate your feedback and feature requests.
👋 Book a discovery call or 👉🏻 Create an account to explore more.